Figures & data
Table 1 Characteristics of Clear Cell Renal Cell Carcinoma Patients in the TCGA Database. TCGA, The Cancer Genome Atlas
Figure 1 IQGAP3 were highly expressed in ccRCC samples. (A) IQGAP3 expression levels in different tumor types from TCGA database were determined by TIMER; (B–E) Data from TCGA, ICGC, GSE53757 and GSE36895 showed that IQGAP3 were highly expressed in ccRCC samples; (F) Based on the UALCAN database, we found that the expression levels of IQGAP3 protein were higher in ccRCC samples than that in normal renal tissues; (G–I) Representative immunohistochemical images derived from the HPA database showed that IQGAP3 protein was “high” immunohistochemical staining in ccRCC samples.
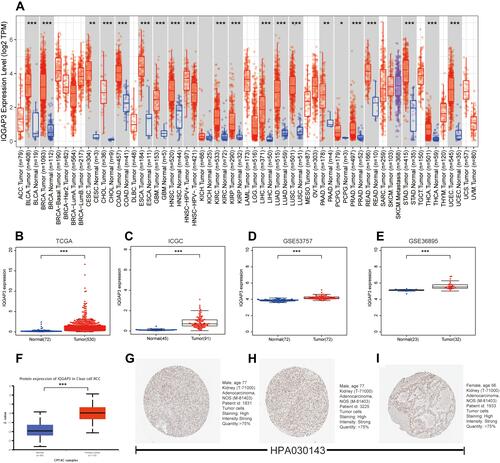
Table 2 Association of IQGAP3 Expression with Clinicopathological Characteristics (Logistic Regression Analysis)
Table 3 Association of IQGAP3 Expression with Clinicopathological Characteristics (Fisher's Exact Test or Chi-Square Test)
Figure 2 The relationship between IQGAP3 expression levels with clinical features of ccRCC. (A) Age; (B) Gender; (C) Stage; (D) Grade; (E) T stage; (F) N stage; (G) M stage.
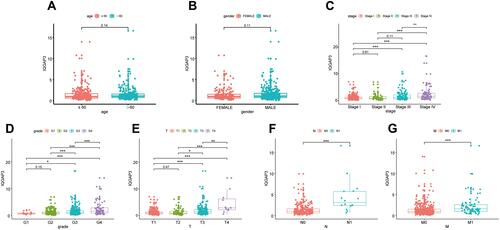
Table 4 Association with Overall Survival and Clinicopathological Characteristics in Patients from the TCGA Database Using Cox Regression. TCGA, The Cancer Genome Atlas
Figure 3 Survival analysis and Cox regression analysis (A) Kaplan–Meier survival analysis showed that patients of the high-IQGAP3 expression subgroup had a worse overall survival rate; (B) Independent prognostic factors identified by multivariate Cox regression analysis.
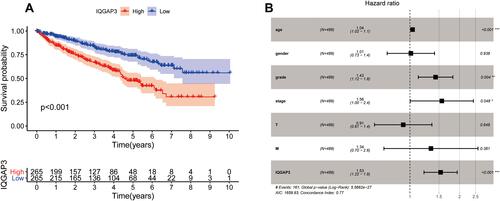
Figure 4 Genetic mutation analyses of IQGAP3 in clear cell renal cell carcinoma (ccRCC) (cBioPortal database). (A) IQGAP3 are altered in 40/537 (7.45%) of 537 cases; (B) The OncoPrint visual summary of alteration on a query of IQGAP3; (C and D) The Kaplan–Meier curves between IQGAP3 altered group and unaltered group.
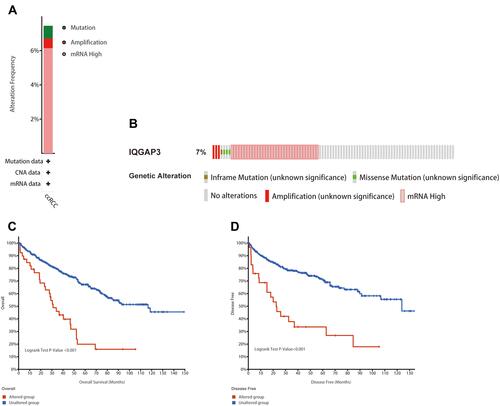
Figure 5 Co-expression analysis. (A) The top 20 positively and negatively genes associated with IQGAP3; (B–D) KIF18B, HJURP and TROAP were strongly associated with IQGAP3; (E–G) KIF18B, HJURP and TROAP were highly expressed in ccRCC tissues; (H–J) Survival analysis results showed that higher expression level of KIF18B, HJURP and TROAP indicated a worse OS for patients with ccRCC.
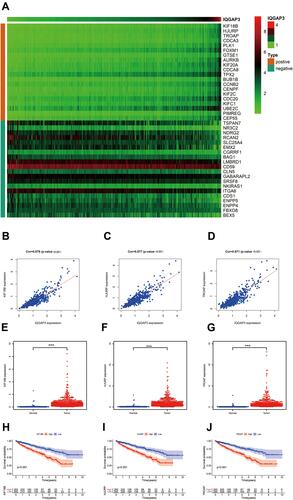
Figure 6 Biological processes enrichment analysis of IQGAP3 and its functional partners (Metascape database). (A) Heatmap of the biological processes enriched terms colored by P-values; (B) Network of biological processes enriched terms colored by P-value; (C) Network of biological processes enriched terms colored by clusters.
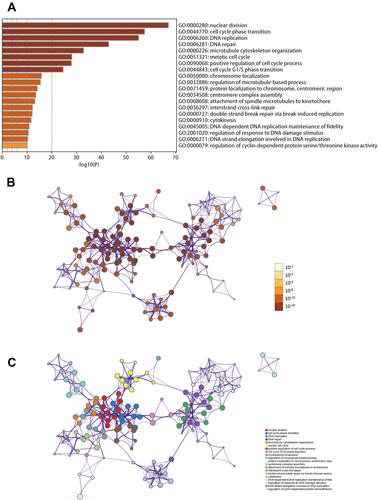
Figure 7 Signaling pathways enrichment analysis of IQGAP3 and its functional partners (Metascape database). (A) Heatmap of the pathways enriched terms colored by P-values; (B) Network of pathways enriched terms colored by P-value; (C) Network of pathways enriched terms colored by clusters.
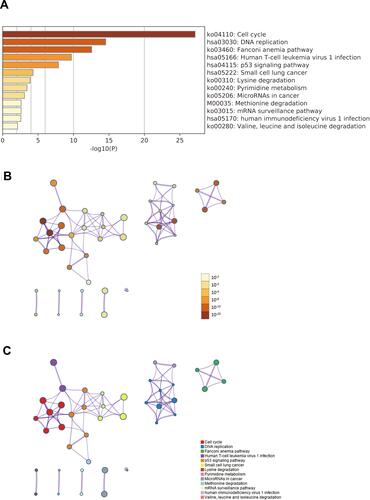
Figure 8 Correlation of TIICs proportion with IQGAP3 expression. (A) Barplot showing the proportion of 21 kinds of TIICs in ccRCC tumor samples; (B) Heatmap showing the correlation between 21 kinds of TIICs and numeric in each tiny box indicating the p value of correlation between two kinds of cells. The shade of each tiny color box represented corresponding correlation value between two cells, and Pearson coefficient was used for significance test; (C) Barplot showed the ratio differentiation of 21 kinds of immune cells between ccRCC tumor samples with low or high IQGAP3 expression relative to the median of IQGAP3 expression level, and Wilcoxon rank sum was used for the significance test.
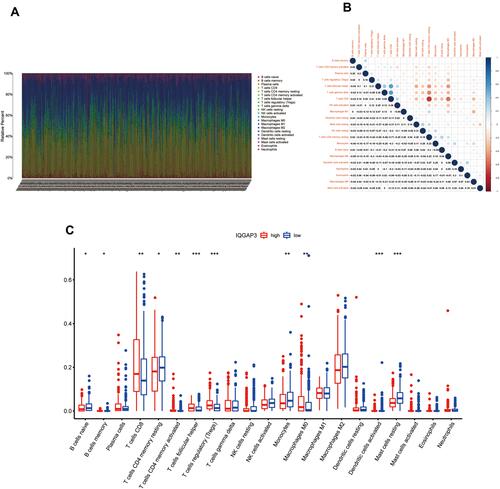
Figure 9 Correlation of immunosuppressive molecules expression with IQGAP3 expression. (A) Circle diagram of correlation between immunosuppressive molecules expression and IQGAP3 expression; (B–E) Correlation analysis results showed that IQGAP3 was positively associated with PD-1, LAG3, CTLA4, and TIGIT; (F–H) Correlation analysis results showed that IQGAP3 was negatively associated with B7H3, TIM3 and VSIR (I) No correlation between IQGAP3 and PD-L1 was found.
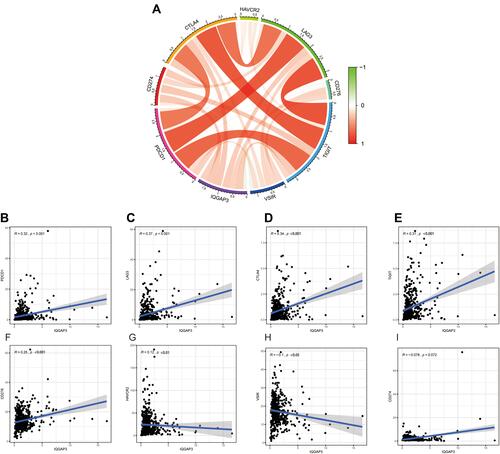
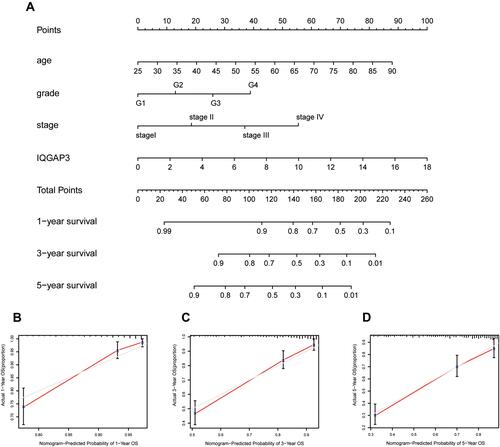
Figure 10 A nomogram consisting of independent clinical features for predicting 1-, 3-, and 5-year OS of ccRCC. (A) Construction of a predictive nomogram; (B–D) Calibration curves revealed that actual and predicted survival matched very well in terms of 1-year, 3-year and 5-year OS of ccRCC.