
Figures & data
Table 1 The Characteristics of the Study Population
Table 2 Agreement and ROC Analysis Between Standard (27.5 kg/m2) and New BMI (24.8 kg/m2) Cutoffs and BF% in Categorizing Obesity
Figure 1 ROC analysis using body mass index (BMI) at two different cutoff values (standard <27.5 kg/m2; optimal <24.8 kg/m2). The area under the curve is larger for BMI <24.8 kg/m2 compared to <27.5 kg/m2.
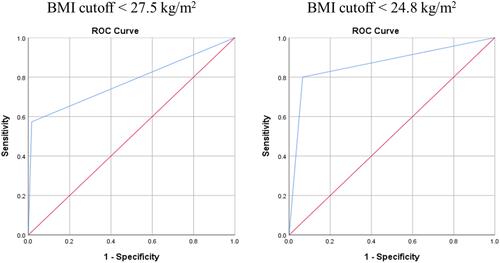
Table 3 The Association Between Hypertension and Obesity Defined Using Standard (27.5 kg/m2) and New Cutoff Values (24.8 kg/m2)