Figures & data
Table 1 Comparison of Clinical Data in Case and Control Groups
Table 2 Basic Information of the Three SNPs in This Study
Table 3 Association Analysis Between SNPs and Alcohol-Induced ONFH Risk
Table 4 Correlation Analysis of Rs62030917, Rs2269556 and Alcohol-Induced ONFH After Stratificated by Age and Hip Lesions in Different Genetic Models
Table 5 Comparative Analysis of Plasma Lipoprotein and Lipid Levels in Carrier with Different Genotypes of Rs4984677, Rs62030917 and Rs2269556
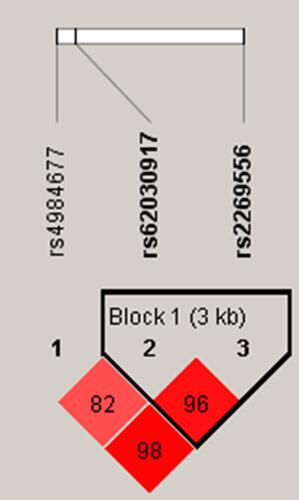
Figure 1 In patients with unilateral lesions, LD plots containing three SNPs from RAB40C.
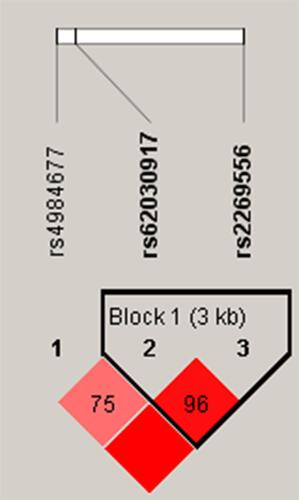
Figure 2 In patients older than 42 years old, LD plots containing three SNPs from RAB40C.