Figures & data
Table 1 Clinical Characteristics of Pregnant Women Participating in the Present Study
Figure 1 Comparison of angiopoietin-2 (pg/mL) levels between control pregnant and GDM-samples. Data are expressed as mean ± standard error. ***P = 0.001 compared to control.
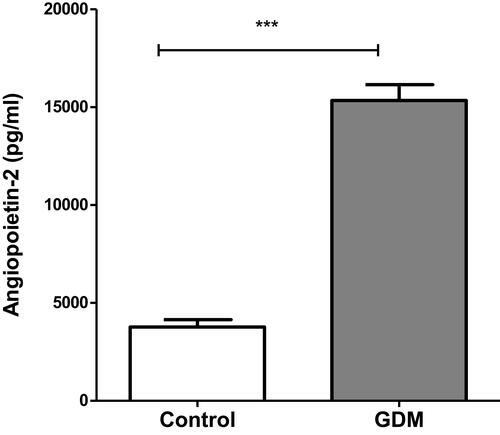
Figure 2 Comparison of VEGF-A (pg/mL) levels between control pregnant and GDM-samples. Data are expressed as mean ± standard error. ***P = 0.001 compared to control.
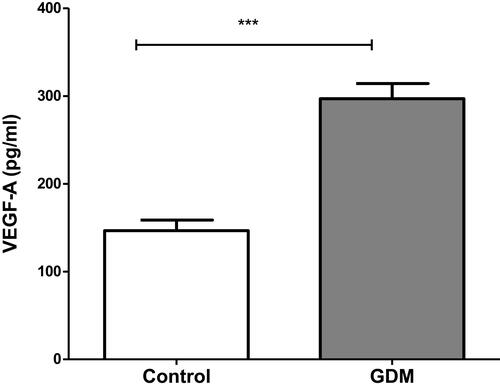
Figure 3 Comparison of endoglin (pg/mL) levels between control pregnant and GDM-samples. Data are expressed as mean ± standard error. *P < 0.05 compared to control.
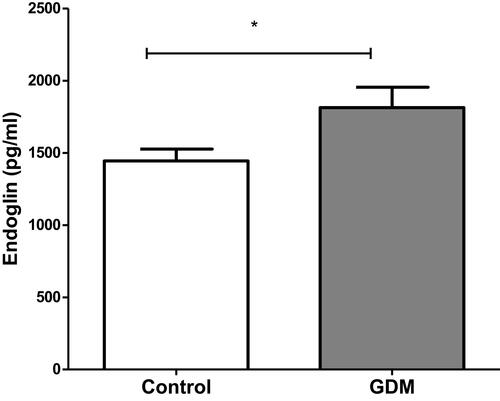
Figure 4 Comparison of endothelin (pg/mL) levels between control pregnant and GDM-samples. Data are expressed as mean ± standard error. *P < 0.05 compared to control.
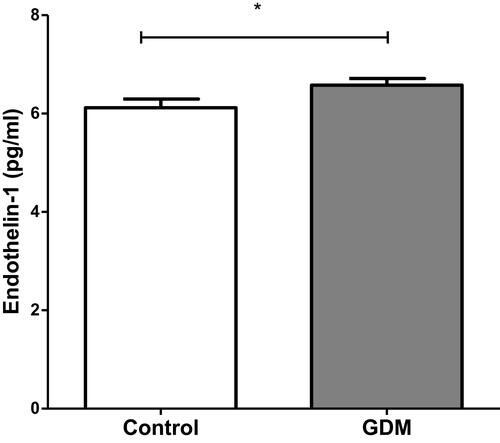
Figure 5 Correlations between endoglin and angiopoietin −2 in control group. The correlation coefficient was made using the Person test.
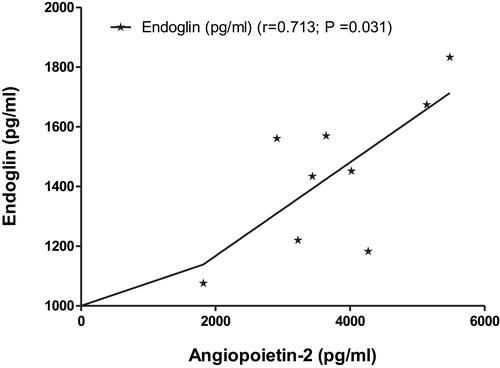
Figure 6 Correlations between angiopoietin −2 and endoglin (A), angiopoietin −2 and endothelin-1 (B) and angiopoietin −2 and VEGF- A (C) in GDM patients. Correlation coefficient was made using Pearson test.
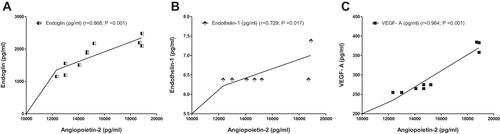
Figure 7 Correlations between G-CSF and endothelin-1 in GDM patients. The correlation coefficient was made using the Pearson test.
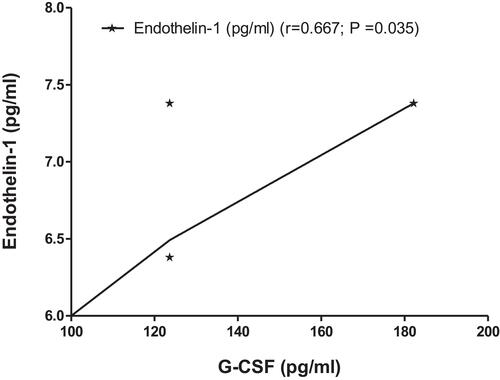
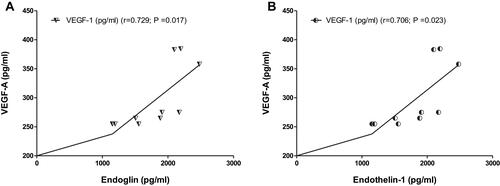
Figure 8 Correlations between endoglin and VEGF-A (A) and endothelin-1 and VEGF-A (B) in GDM patients. The correlation coefficient was made using the Pearson test.