Figures & data
Table 1 Cases of Neonatal E. coli Meningitis in Different Periods
Table 2 Distribution of Pathogens of Neonatal Meningitis in 2001–2006, 2007–2012 and 2013–2020 Were Analyzed by Pearson’s Chi-Squared Test
Table 3 General Characteristics of Patients with Neonatal E. coli Meningitis
Figure 1 Antimicrobial susceptibility of all isolated E. coli in different periods were analyzed by Pearson’s chi-squared test. *P < 0.05. **P < 0.01.
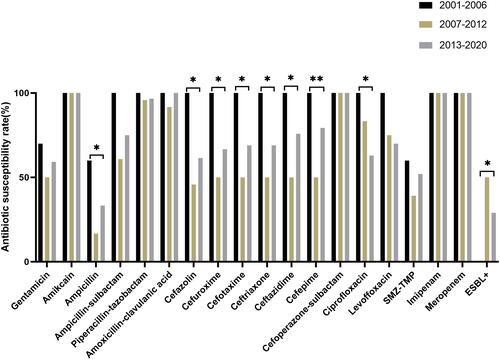
Figure 2 Antimicrobial susceptibility of all isolated E. coli from term and premature infants. There is no significant difference between the two groups.
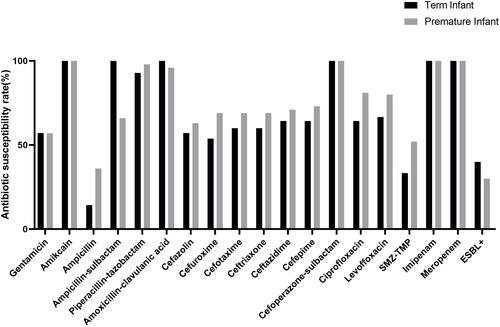
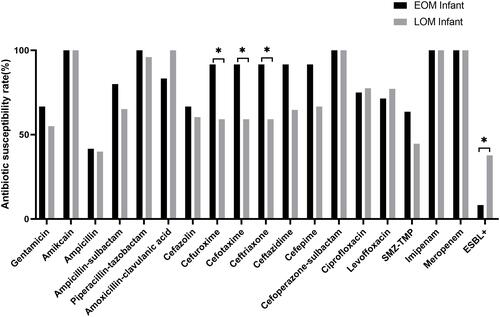
Figure 3 Antimicrobial susceptibility of all isolated E. coli from EOM and LOM. *P < 0.05.