Figures & data
Table 1 Differential Expression of 76 DEARGs Identified by Taking the Intersection of 1957 DEGs and 796 ARGs
Figure 1 Identification of DEARGs. (A) Differential expression analysis of 1957 DEGs. (B) Identified 76 DEARGs. (C) Heatmap for the differential expression of 76 DEARGs between NAFLDs and normal. (D) Box plot of the differential expression of 76 DEARGs between NAFLDs and normal.
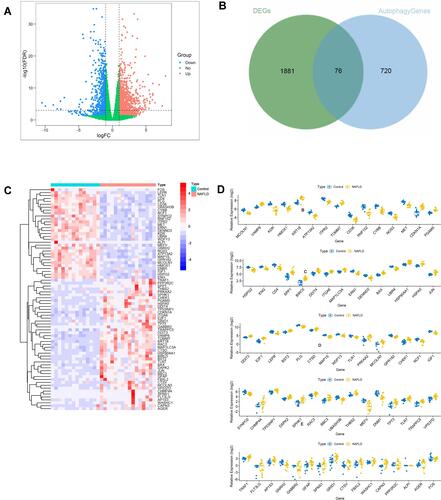
Table 2 The GO Enrichment Analysis (BP, MF, CC)
Figure 2 Functional enrichment of the DEARGs. (A) BP enrichment analysis of 76 DEARGs. (B) CC enrichment analysis of 76 DEARGs. (C) MF enrichment analysis of 76 DEARGs. (D) KEGG pathway enrichment analysis of 76 DEARGs.
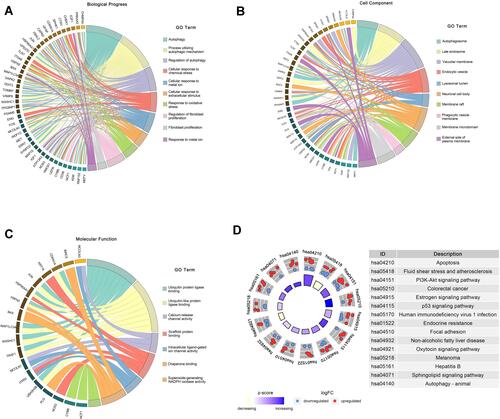
Table 3 The KEGG Pathway Enrichment Analysis
Figure 3 Identification and verification of hub genes. (A) PPI network analysis of 76 DEARGs (minimum required interaction score 0.7). (B) Identification of hub genes. (C) Volcano plot of the distribution of hub genes expression. (D) Validation of identified gene expression between NAFLDs and normals. (**P<0.01, ***P<0.001, ****P<0.0001).
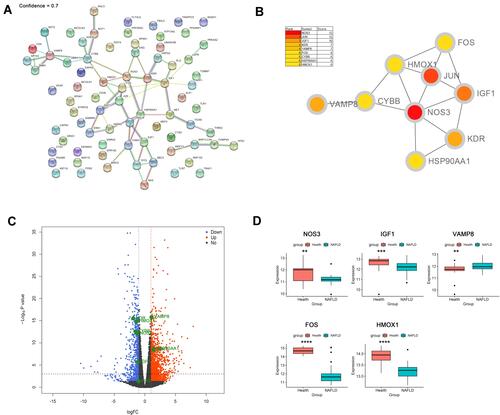
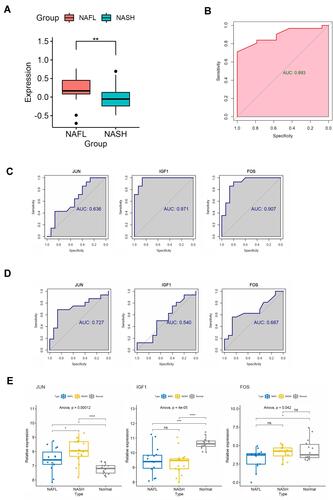
Table 4 Hub Genes Participate in the MAPK Pathway Based on the KEGG Pathway Enrichment Analysis
Figure 4 Identification of central signaling pathways and genes in the development of NAFLD. (A) Difference of MAPK pathway between NAFLs and NASHs by GSVA algorithm. (B) ROC curve to evaluate the effectiveness of the GSVA scores. (C) ROC curves to evaluate the diagnostic value of the identified genes between NAFLDs and normal. (D) ROC curves to evaluate the diagnostic value of the genes between NASHs and NAFLs. (E) The expression of the genes between NASHs, NAFLs, and normal. (*P<0.05,**P<0.01, ***P<0.001, ****P<0.0001).