Figures & data
Table 1 Details of GEO Data
Figure 1 Identification of DEGs in TB, DM, and HC samples. (A) 478 significant DEGs detected in TB as compared to HC samples. (B) 126 significant DEGs detected in DM as compared to HC samples. (C) 869 significant DEGs detected in TB+DM as compared to HC samples. Red dots represent selected up-regulated genes and blue dots represent selected down-regulated genes. Black dots represent genes with no significant inter-group expression differences. (D) 350 DEGs shared by both TB and TB+DM groups. (E) 72 DEGs shared by both DM and TB+DM groups.
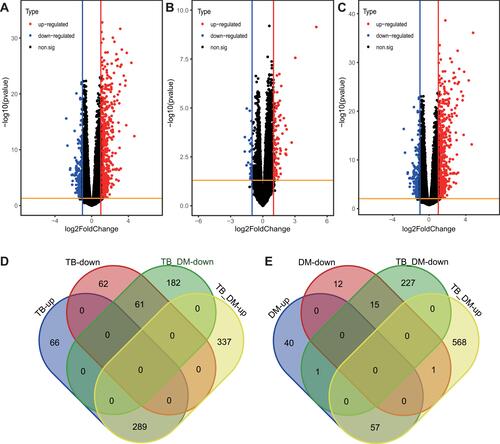
Figure 2 Functional enrichment analysis of common DEGs. (A–D) represent results of BP, CC, MF, and KEGG pathway analyses of DEGs, respectively.
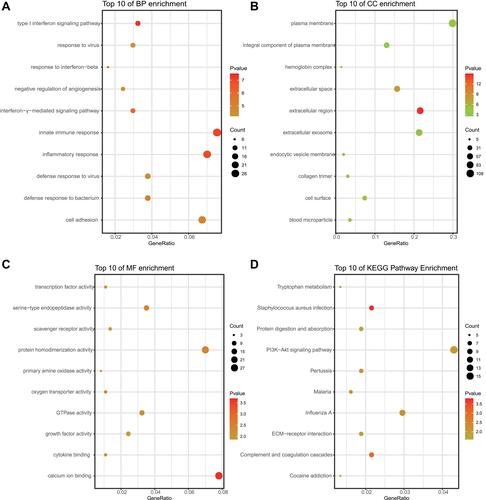
Table 2 Top 10 Hub Genes
Figure 3 PPI network analysis. (A) Ten hub genes were selected using the plug-in cytoHubba of Cytoscape based on MCC scores. (B) Interactions between MET target genes and hub genes. Dots represent genes and edges represent functional connections between genes.
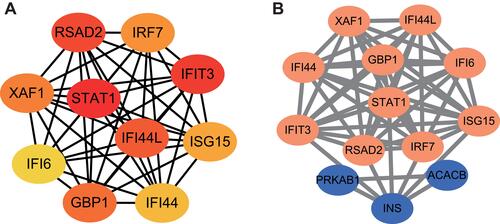
Figure 4 Relative expression of hub genes including (A) STAT1, (B) IFIT3, (C) RSAD2, (D) IFI44L, (E) GBP1, (F) XAF1, (G) IRF7, (H) IFI44L, and (I) IFI6 as measured by reverse transcription-quantitative polymerase chain reaction (RT-qPCR). RQ represents relative quantification values; *Represents P-value <0.05.
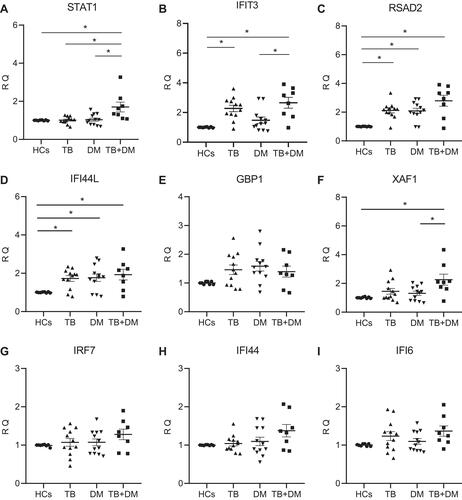
Table 3 miRNA and Its Target Genes
Figure 5 Interaction network between hub genes and their targeted miRNAs. Red dots represent hub genes, orange dots represent miRNAs, and blue dots represent miRNAs targeting two genes simultaneously.
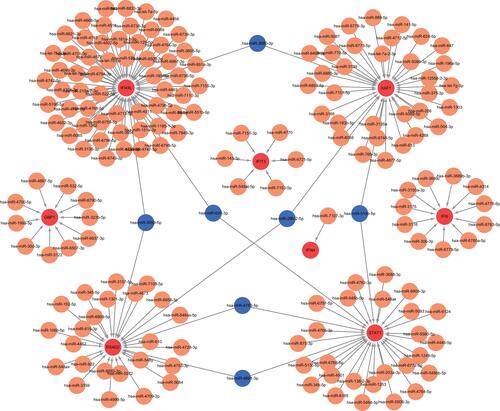
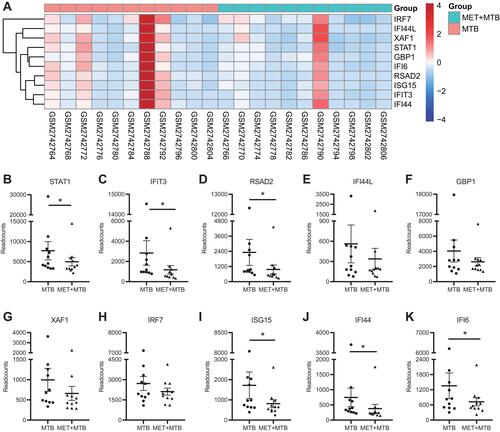
Figure 6 Gene expression changes of ten hub genes after MET treatment of MTB-infected PBMCs. (A) Hierarchical clustering heatmap of hub genes of MET+MTB and MTB groups. Red indicates relatively up-regulated gene expression, blue indicates relatively down-regulated gene expression, and white indicates no significant change in gene expression. (B–K) Representative gene expression profiles of 11 MET+MTB-treated PBMCs and 11 MTB-treated PBMCs. *Represents P-value <0.05.