Figures & data
Figure 1 Workflow for exploring the molecular mechanisms of Scutellaria barbata against Hepatocellular carcinoma.
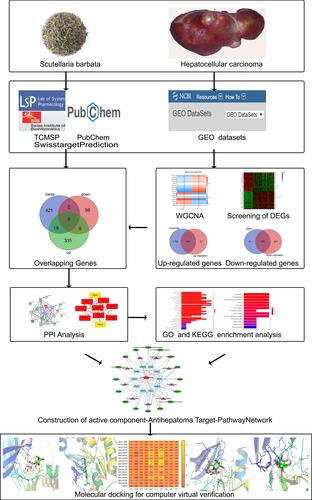
Table 1 Detail Information of 16 Compounds of Scutellaria barbata
Figure 2 Identification of hub targets of HCC. (A) Volcano plot of DEGs, (B) Heatmap of the top 50 up-regulated and down-regulated DEGs, (C)Analysis of the scale-free network coefficient R-squared for the soft threshold, (D) A cluster dendrogram was built based on the dissimilarity of the topological overlap, (E) Module-trait relationships.
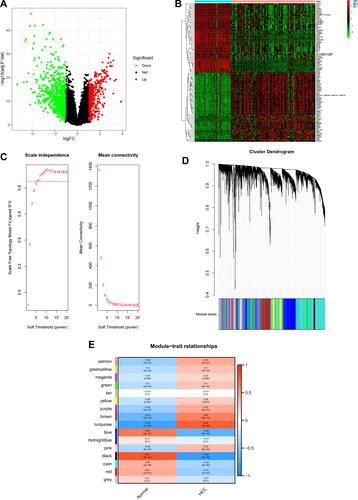
Figure 3 Venn diagram. (A) Venn diagram of turquoise module and up-regulated DEGs, (B) Venn diagram of black module and down-regulated DEGs, (C) Venn diagram of up-regulated overlapping genes, down-regulated overlapping genes and SwisstargetPrediction targets.
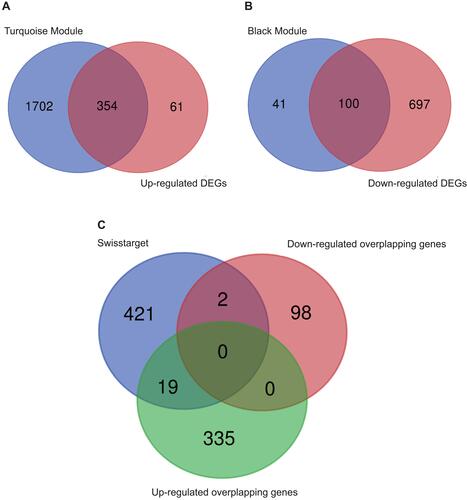
Table 2 Cross Verification of the 10 Critical Target Genes and Compounds of Scutellaria barbata
Figure 4 PPI analysis. (A) PPI network of the 19 up-regulated targets without disconnected nodes. (B) 10up-regulated targets that were screened according to the MCC and DC.
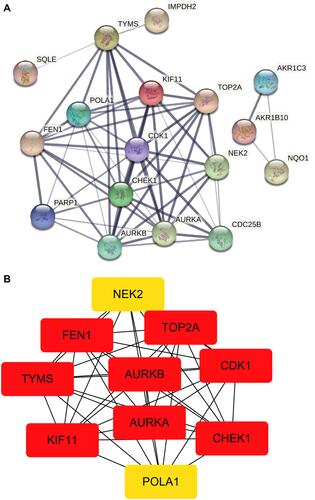
Figure 5 Active component-anti-hepatoma target-pathway network of Scutellaria barbata.
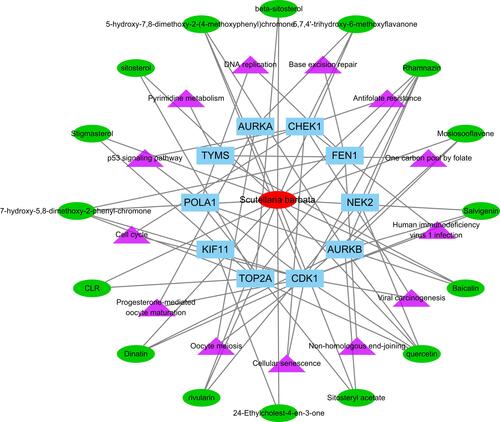
Figure 6 The results of GO enrichment analysis. (A) The barplot of GO enrichment analysis, (B) The bubble plot of GO enrichment analysis. “Gene ratio” means the percentage of the genes that enriched in corresponding pathway in all the genes that annotated in GO dataset.
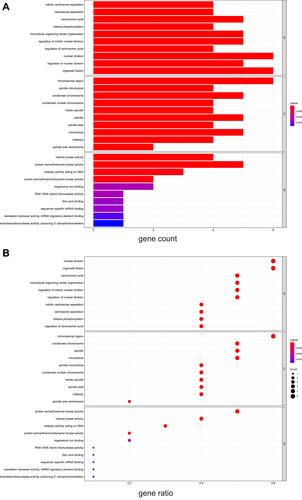
Figure 7 The results of KEGG pathways enrichment analysis. (A) The barplot of KEGG analysis, (B) The bubble plot of KEGG analysis. “Gene ratio” means the percentage of the genes that enriched in corresponding pathway in all the genes that annotated in GO dataset.
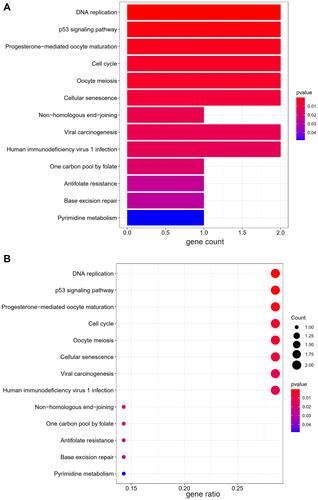
Table 3 Information of Proteins Involved in Molecular Docking
Figure 8 The results of molecular docking. (A) Heatmap of binding energy between active components and target proteins, (B) Visualization of molecular docking between MOL000449 and AURKB, (C) Visualization of molecular docking between MOL002776 and CHEK1, (D) Visualization of molecular docking between MOL002776 and NEK2, (E) Visualization of molecular docking between MOL000098 and CHEK1.
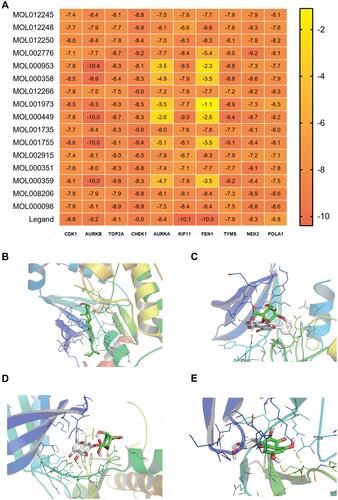
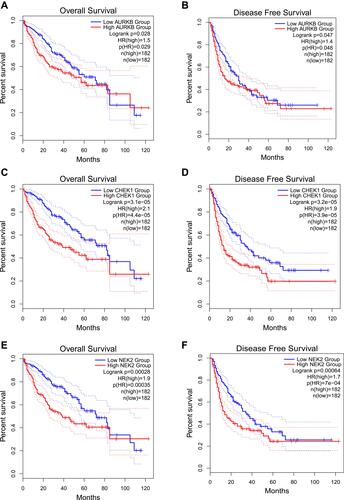
Figure 9 The results of Prognostic value of AURKB, CHEK1 and NEK2. (A) Overall Survival Kaplan-Meier curve of AURKB, (B) Disease Free Survival Kaplan-Meier curve of AURKB, (C) Overall Survival Kaplan-Meier curve of CHEK1, (D) Disease Free Survival Kaplan-Meier curve of CHEK1, (E) Overall Survival Kaplan-Meier curve of NEK2, (F) Disease Free Survival Kaplan-Meier curve of NEK2.