Figures & data
Table 1 Characteristics of TCGA Cohort with Clear Cell Renal Cell Carcinoma
Figure 1 (A) Gene Ontology (GO) analysis of differentially expressed genes (DEGs) in pRCC and mRCC samples. (B) Circle graphs of the first five pathways and the DEGs involved in the biological process of GO. (C) The six HSP-related HUB genes and their interaction network with DEGs were obtained by Cytoscape.
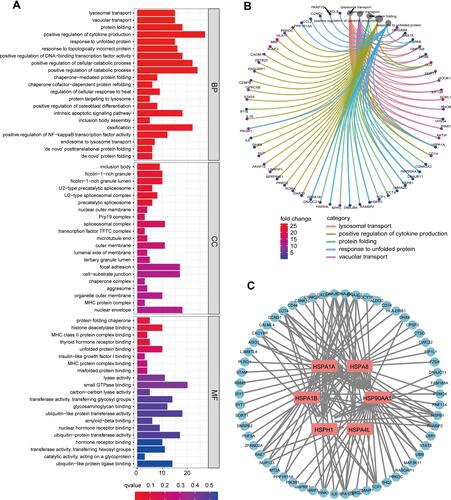
Figure 2 (A) The expression differences of the six HSP genes in TCGA cohort between the normal and tumor groups. (B) The differences in expression of the six HSP genes in TCGA cohort between advanced stage patients (Stage III and IV) and early stage patients (Stage I and II). (C) Differences in survival between the six HSP genes in TCGA cohort (median expression value is intercept).
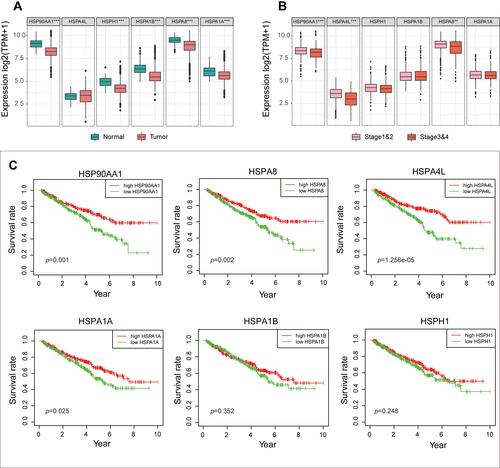
Figure 3 (A) Unsupervised consistent clustering analysis to obtain the best clustering results for patients in TCGA cohort (k = 2). (B) Heat map of expression of the six genes in Cluster1 (C1) and Cluster2 (C2). (C) The PCA clustering results of patients in TCGA cohort are colored according to the consistent clustering results (PCA analysis is based on genome-wide genes, and the mean value>0.5 was used as the criterion for gene inclusion). (D) Survival analysis of C1 and C2 patients.
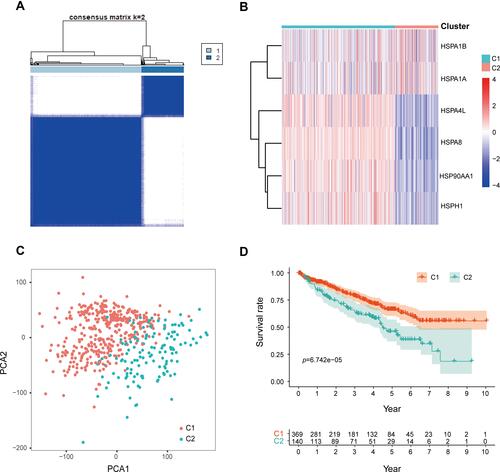
Figure 4 (A) TIMER 2.0 was used to evaluate the association between the six HSP genes and CD4+ T cells, CD8+ T cells, macrophages, and B cells in ccRCC. (B) The correlation between HSP90AA1, HSPA4L, and HSPA8 and CD4+ T cells and TH1 CD4+ T cells. (C) The difference in immune cell infiltration between C1 and C2 patients using CIBERSORT (p <0.05). Differences in the expression of three immune checkpoints (ICPs) in C1 and C2 patients.
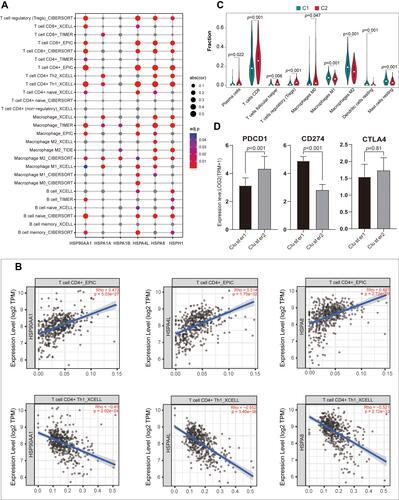
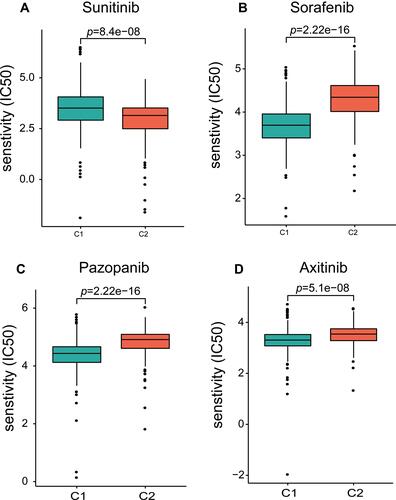
Figure 5 Differences in response sensitivity of C1 and C2 patients to sunitinib (A), sorafenib (B), pazopanib (C), and axitinib (D).