Figures & data
Figure 1 The top 20 genes upregulated in microarrays. COL1A1, COL1A2, COL6A3, and SULF1 mRNA were statistically significantly overexpressed in Chen Gastric,Citation10 Cho Gastric,Citation11 Cui Gastric,Citation12 and Wang GastricCitation13 datasets from the ONCOMINE database. Genes with red had significant and consistent overexpression in the five studies.
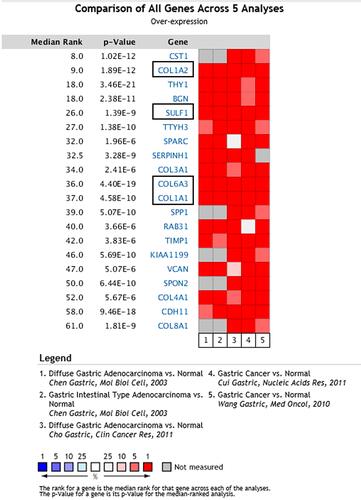
Figure 2 Correlation between different expressed COL1A1, COL1A2, COL6A3, and SULF1 chemokines, and the tumor node metastasis (TNM) stage of gastric cancer patients (GEPIA2) p < 0.05.
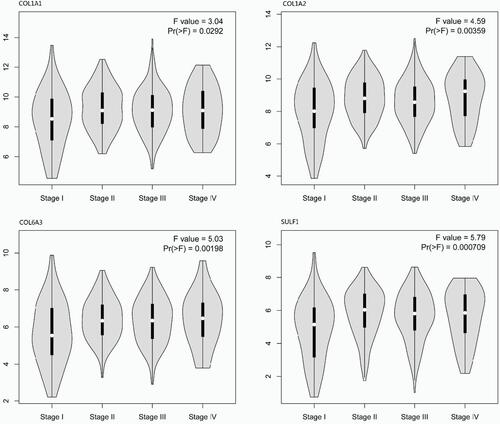
Figure 3 Pearson correlation analyses between ERBB2 and COL1A1, COL1A2, COL6A3, and SULF1 genes.
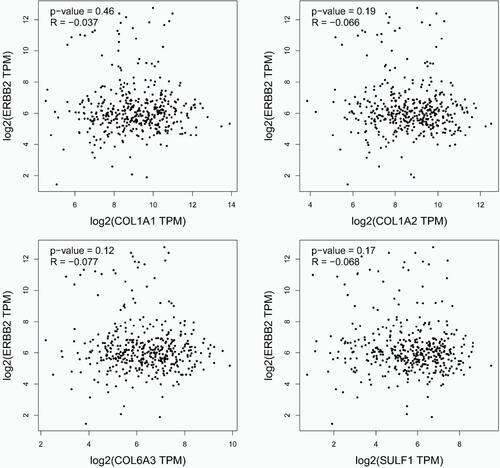
Figure 4 Protein-protein interaction network of different expressions of COL1A1, COL1A2, COL6A3, and SULF1 genes. (A) related to COL1A1; (B) related to COL6A3; (C) related to SULF1 genes.
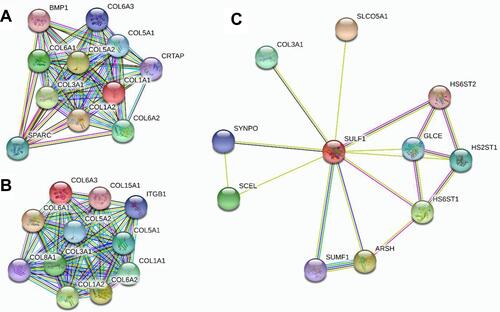
Figure 5 The prognostic value of different expressed COL1A1, COL1A2, COL6A3, and SULF1 chemokines in gastric cancer patients in the overall survival curve (Kaplan–Meier plotter).
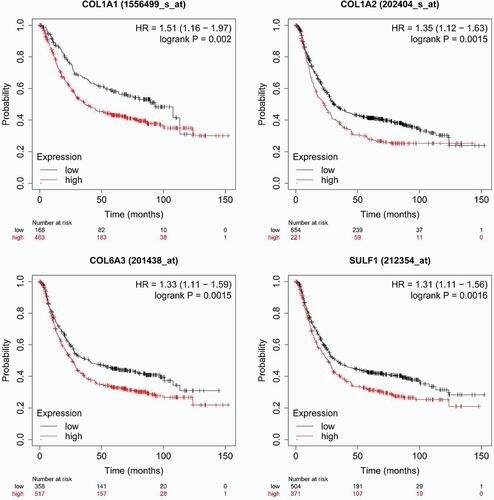
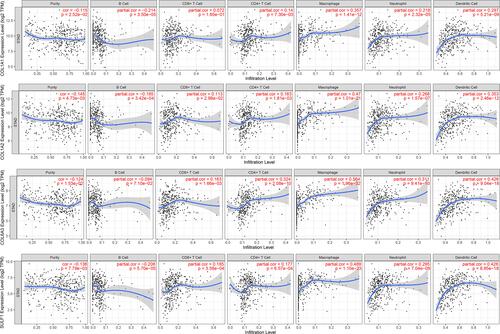
Figure 6 The correlation between different expressions of COL1A1, COL1A2, COL6A3, and SULF1 chemokines and immune cell infiltration (TIMER).