
Figures & data
Figure 1 The flow chart describing the procedure used for patients selection.
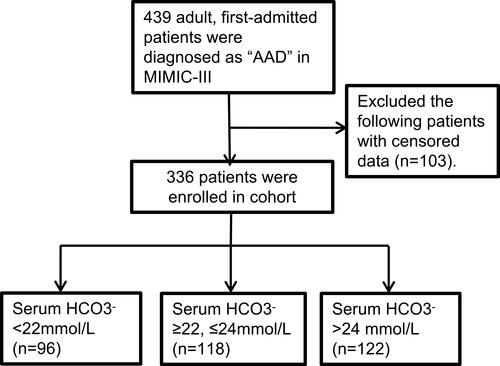
Table 1 Characteristics of Subjects
Figure 2 The KM survival curve of low-HCO3−, mid-HCO3− and high-HCO3− groups.
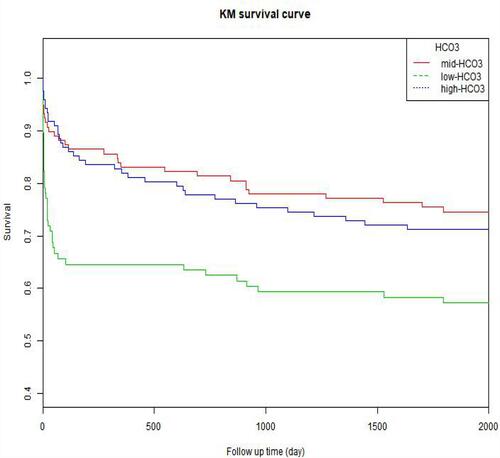
Table 2 HRs (95% CIs) for Mortality Across Groups of Serum HCO3−
Table 3 Subgroup Analysis of the Associations Between Serum HCO3− and 30-Day All-Cause Mortality
Table 4 Area Under Receiver Operating Characteristic Curve of HCO3− and Severity Scores