Figures & data
Figure 1 Expression of distinct E2Fs family members in chRCC tissues and adjacent normal kidney tissues. (A) Differential expression analysis of RNAseq data of E2Fs expression in chRCC and normal samples from TCGA. (B) The transcriptional levels of E2Fs in chRCC and normal samples (UALCAN). ns, p≥0.05; *p< 0.05; ***p<0.001.
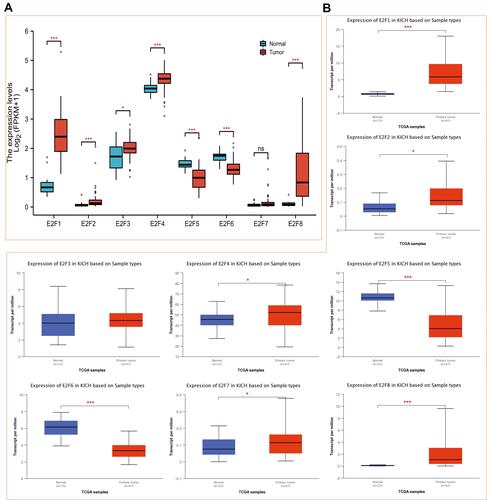
Figure 2 Correlation between E2Fs expression and pathologic stage in chRCC patients. (A) Relationship between mRNA expression of distinct E2Fs family members in normal and individual cancer stages of chRCC (UALCAN). (B) Correlation between different expressed E2Fs and the pathological stage of chRCC patients (GEPIA). *p< 0.05; **p<0.01; ***p<0.001.
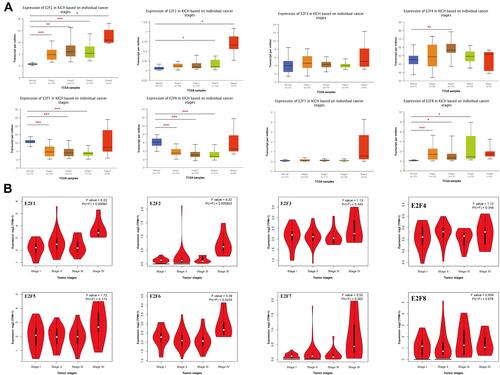
Figure 3 Prognostic role of E2Fs expression in chRCC patients (A: GEPIA, B) UALCAN).
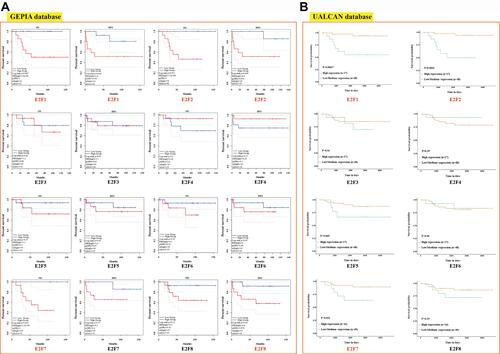
Figure 4 Prognostic analysis of gene signature in the TCGA set. The dotted line represented the risk score and divided the patients into Exp 0–25% group, 25–50% group, 50–75% group, and 75–100% group. (A, D, G and J) The curve of risk score. Survival status of the patients. More dead patients corresponding to the higher risk score. Heatmap of the expression profiles of the E2F1/2/7/8 in Exp 0–25% group, 25–50% group, 50–75% group, and 75–100% group. (B, E, H and K) Kaplan-Meier survival analysis of E2F1/2/7/8. (C, F, I and L) Time-dependent ROC analysis of E2F1/2/7/8. ROC: receiver operating characteristic.
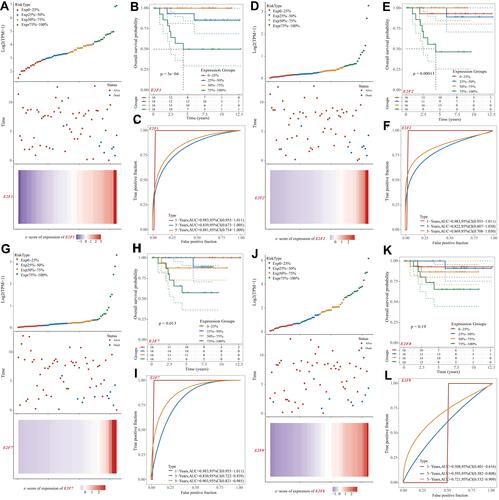
Figure 5 Genetic mutations in E2Fs and their association with OS, DFS, DSS, and FP of chRCC patients (cBioPortal). A high mutation rate (34%) of E2Fs was observed in chRCC patients. E2F3/5/8 ranked the highest three genes of genetic alterations, and their mutation rates were 11%, 11%, and 11%, respectively (A). mRNA expression z-scores of E2Fs relative to normal samples (B). Genetic alterations in E2Fs were associated with shorter overall survival (OS) 1.514 (C and G), Disease-Specific Survival (DFS) (E and I), and Progression-Free Survival (FP) (F and H) of chRCC patients. No association was noticed between the genetic alterations of E2Fs and Disease-Free Survival (DFS) in chRCC (D).
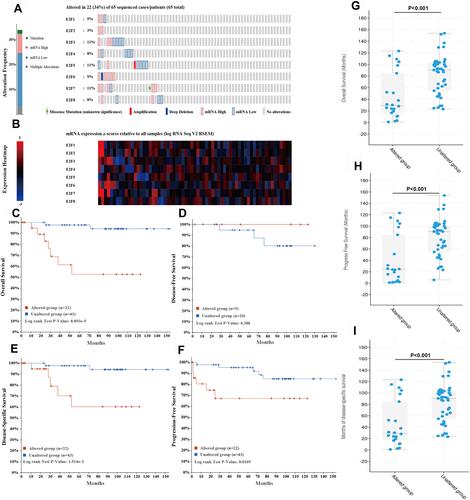
Figure 6 Correlation heatmaps of E2Fs and their most correlated genes in chRCC. (A) Correlation heatmap of different expressed E2Fs in chRCC. Red and blue cells indicate co-occurrence and mutual exclusivity, respectively. (B–I) Correlation heatmap of E2F1-8 expression and their top 20 correlated genes. *p< 0.05; **p<0.01; ***p<0.001.
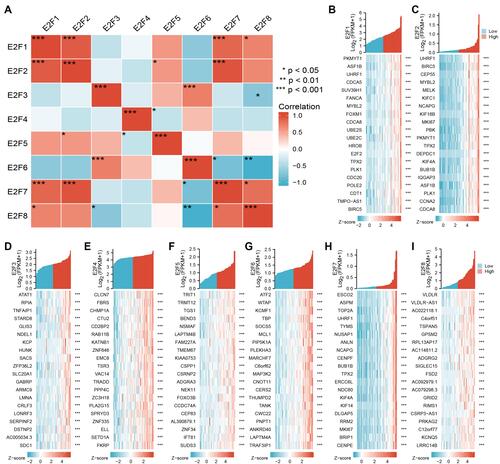
Figure 7 Enrichment analysis of E2Fs and their most correlated genes in chRCC. (A) Gene-gene interaction network for E2Fs and most correlated genes (Cytoscape). (B) Interaction network of hub genes with a higher degree of connectivity. (C–F) The functions of E2Fs and their most correlated genes were predicted by the analysis of gene ontology (GO, and Kyoto Encyclopedia of Gene and Genomes (KEGG) by Metascape tolls). Go and KEGG enrichment analysis predicted the functional roles of target host genes based on four aspects, including (C) biological process, (D) cellular components, (E) molecular functions, and (F) KEGG pathway analysis.
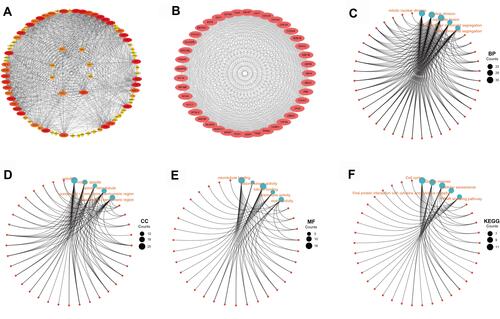
Figure 8 Interactions of E2Fs expression and immune system. (A) Correlation heatmap of E2Fs expression and immune cell infiltration in chRCC. (B) Correlation heatmap of E2Fs expression and immune cells related gene markers. (C) Correlation heatmap of E2F1/2/7/8 expression and 28 tumor-infiltrating lymphocytes (TILs) types. (D) Correlation heatmap of E2F1/2/7/8 expression and 24 immunoinhibitor types. (E) Correlation heatmap of E2F1/2/7/8 expression and 46 immunostimulator types. (F) Correlation heatmap of E2F1/2/7/8 expression and 36 MHC molecule types. The correlation values were normalized by row scale (C–F).
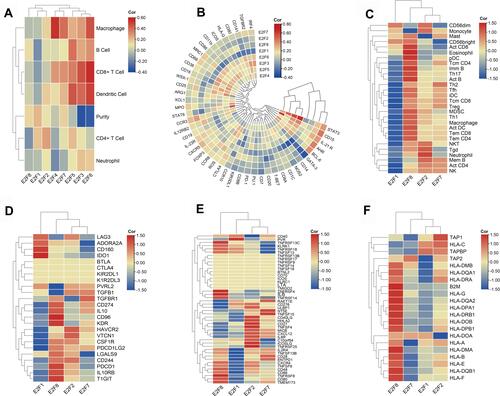
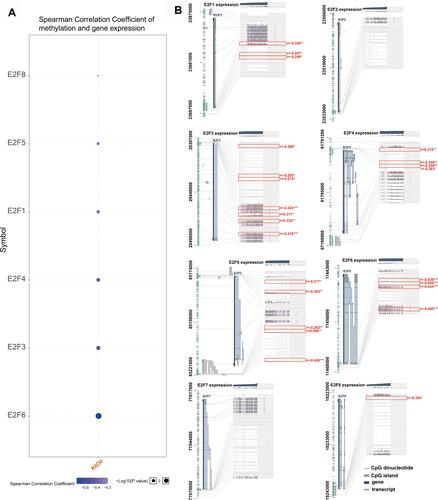
Figure 9 Correlation between E2Fs expression and methylation levels. (A) Spearman correlation between methylation and expression of E2Fs (GSCALite, only positive genes were presented). (B) Association between E2Fs expression and DNA methylation, the Benjamini-Hochberg-adjusted p-value, and the Pearson correlation coefficients (r) are displayed (MEXPRESS). *p< 0.05; **p<0.01; ***p<0.001.