Figures & data
Figure 1 The mRNA expression of BGN in STAD. (A) Expression profile across tumor samples and paired normal tissues. (B) mRNA Expression profile in cancer cell lines. (C) Differential expression of BGN in normal and STAD tissues. *P<0.05 and ***P<0.001.
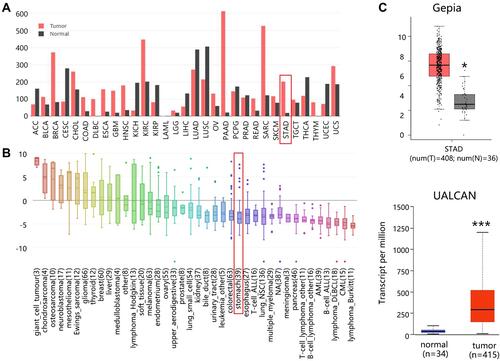
Figure 2 The association of BGN mRNA expression with clinical phenotype of patients with STAD. ***P<0.001.
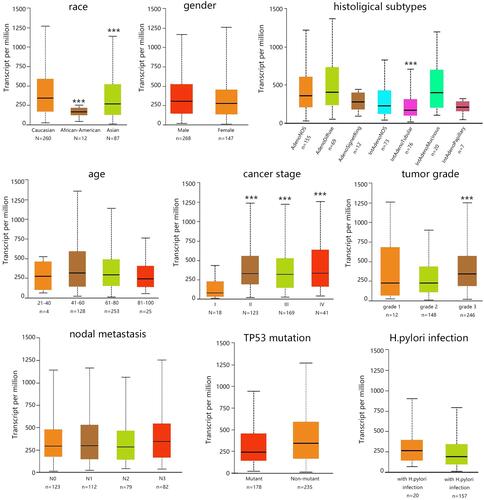
Figure 3 The BGN protein expression. (A) Immunohistochemical images in normal and STAD tissues. (B) Protein location of BGN in cancer cell. (C) The immunofluorescence staining of BGN in cancer cell.
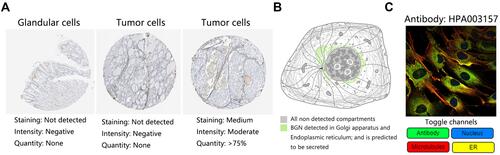
Figure 4 The genetic alteration of BGN in STAD. (A) Mutation sites. (B) Genetic alteration based on cancer type. (C) Distribution of different types of mutations for BGN in stomach cancer.
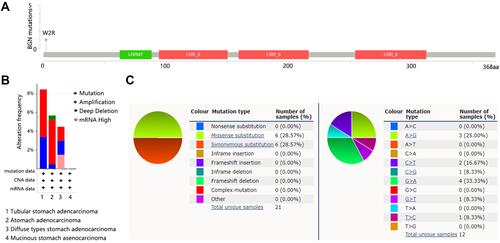
Figure 5 Prognosis analysis on immune cells in stomach adenocarcinoma.
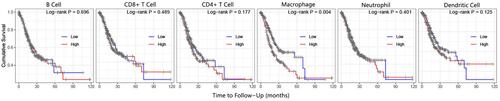
Figure 6 Spearman correlations between abundance of cytokine and BGN expression in STAD. (A) Tumor-infiltrating lymphocytes. (B) Immunoinhibitor. (C) Immunostimulator. (D) Chemokine.
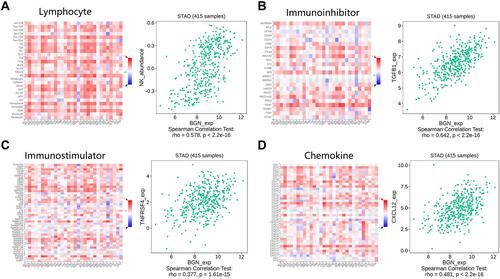
Figure 7 Comparison analysis on BGN expression. (A) Expression difference between responders and non-responders. Points in the above scatter plot represent the expression difference of BGN in various data sets. Oval marker: dataset showing statistical significance. (B) Mutation difference between responders and non-responders. Points in the above scatter plot represent the mutation difference of BGN in various data sets. (C) Expression difference based on immune subtypes in STAD. (D) Expression difference based on molecular subtypes in STAD.
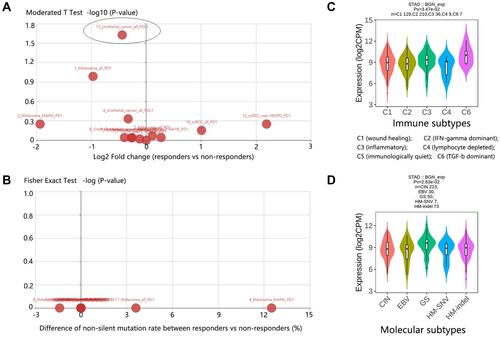
Figure 8 The influence of BGN expression on the overall survival of patients.
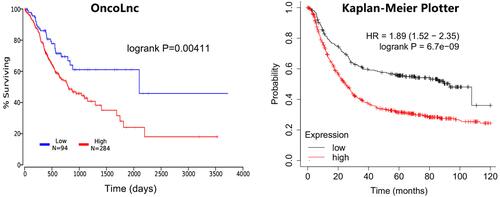
Table 1 The Restrict Prognosis Analysis Between BGN High and Low Expression Groups
Table 2 Cox Regression Results for BGN in Human Cancers
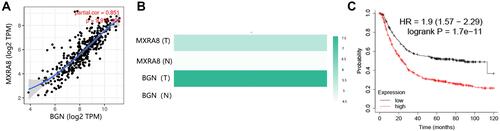
Figure 9 Co-expressed genes analysis. (A) Whole protein–protein interaction (PPI) network. (B) MCODE network with highest score in PPI network. MXRA8: seed gene.
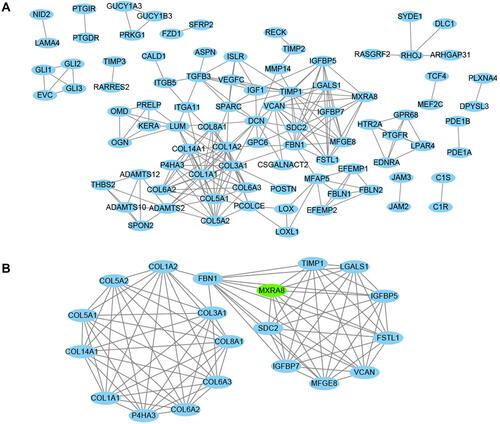
Table 3 The Top 5 Consistent KEGG Pathways Predicted in Three Databases
Figure 10 MXRA8 expression analysis. (A) Correlation of BGN with MXRA8 adjusted by tumor purity. (B) Expression comparison in normal/STAD tissues. (T: tumor; N: normal). (C) Survival analysis on MXRA8.