Figures & data
Figure 1 Flowchart.
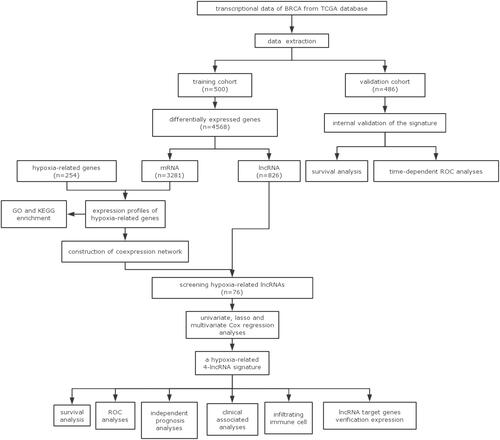
Figure 2 Screening different expressed hypoxia-related genes. (A) Heatmap of significantly different expressed genes (DEGs). (B) Volcano map; green represents down-regulated of genes, and red represents up-regulated of genes. (C) Venn plot.
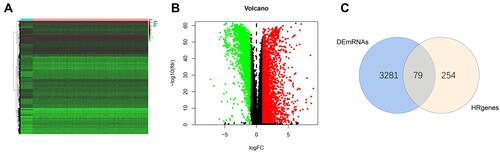
Figure 3 GO and KEGG pathway enrichment. (A) Gene oncology (GO) and (B) KEGG pathway analyses.
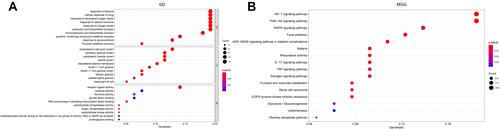
Table 1 4-lncRNA Signature Identified by Multivariate Cox Regression Analyses
Figure 4 A prognostic risk model was constructed from the prognostic 4‐lncRNAs signature. (A) Hypoxia-related mRNA-lncRNA co-expression network (B) A forest map showed 8 DElncRNA pairs identified by Cox proportional hazard regression (C) Plots of the cross-validation error rates. (D) LASSO coefficient profiles of the 8 prognostic lncRNAs.
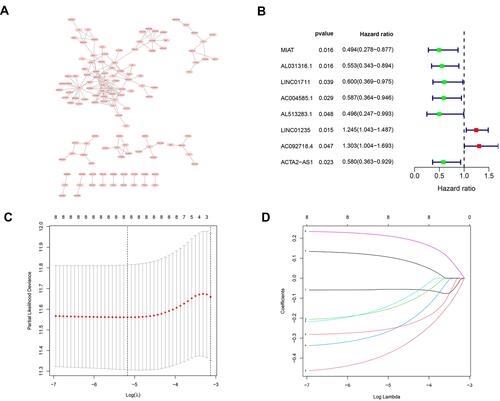
Figure 5 Risk score analysis of disease-specific survival related prognostic models (A) Survival curve for low-risk and high-risk subgroups. (B) Risk score distribution, survival status and expression heat map. (C) PCA maps show the distribution of patients based on the all genes, hypoxia- related lncRNAs and risk genes.
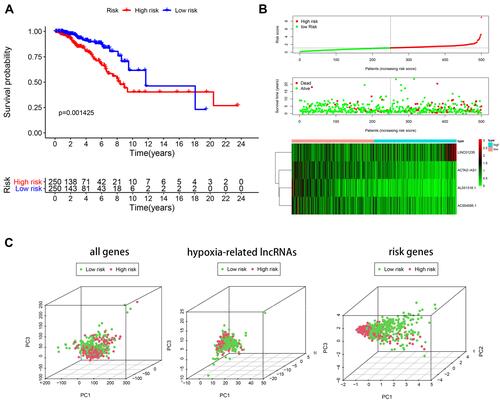
Figure 6 Internal validation. (A) Survival curve for low-risk and high-risk subgroups in the validation cohort. (B) Time-dependent ROC curve comparison of the validation cohort. AUCs at 1, 3, 5 and 7 years were calculated.
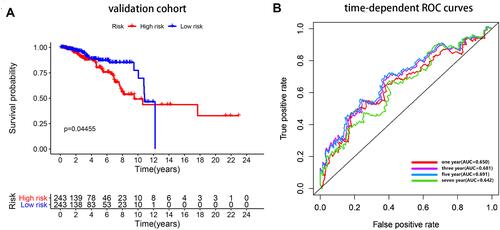
Figure 7 Performance of the 4-lncRNA-based model in subgroups of clinicopathological features. Kaplan–Meier curves show the prognostic prediction performance in subgroups of age (A and B), tumor stage (C and D), stage T (E and F), stage M (G and H) as well as stage N (I and J).
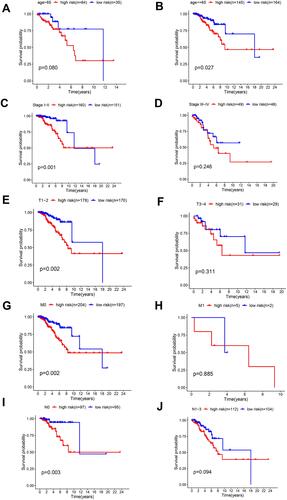
Figure 8 Confirmation of prognostic value of the 4 lncRNAs in BRCA patients and independent predictive power of the lncRNA signature in breast cancer patients. (A) Survival analysis of OS based on clinicopathological parameters in patients with BRCA (B) A comparison of ROC curves with other common clinical characteristics showed the superiority of the risk score. (C) Univariate Cox analysis. (D) Multivariate Cox analysis.
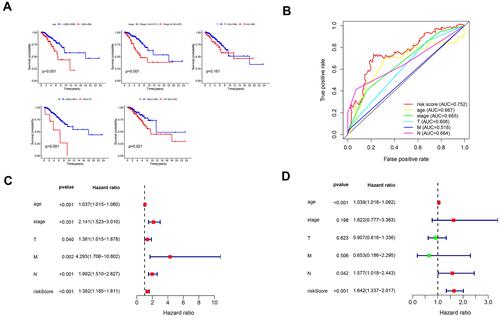
Figure 9 Relationships between the hypoxia-related prognostic model and infiltration abundances of six types of immune cells. Pearson correlation analysis was performed to determine the correlation. (A) B cells; (B) CD8+T cells; (C) dendritic cells; (D) CD4+T cells; (E) macrophages and (F) neutrophils.
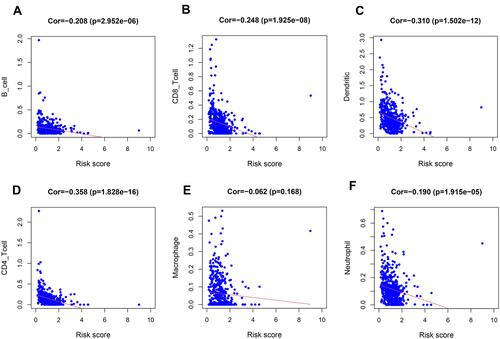
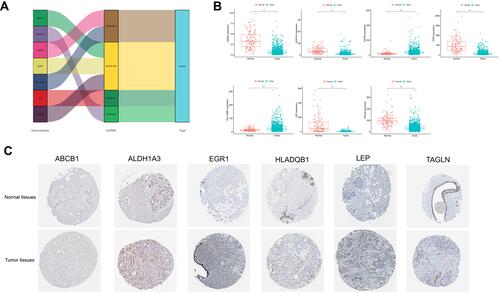
Figure 10 Verification of hypoxia-related genes expression. (A) Sankey plot (B) Hypoxia-related gene expression in tumor samples and normal tissue. (C) Validation of hypoxia-related gene expression based on the HPA database.