Figures & data
Table 1 The Distribution of TP53 Pro72Arg Polymorphism in the T2DM Patients and Non-Diabetic Controls
Table 2 Clinical Characteristics of T2DM Patients, Stratified According to the TP53 Pro72Arg Polymorphism
Figure 1 The diabetic complication rates of T2DM patients stratified according to TP53 Pro72Arg polymorphism. Numbers within the bars represent number of observed patients with complications and total number of surveyed patients. Significant level in multiple comparisons among the three genotype groups was adjusted using Bonferroni correction, and the p values in bold type were significant differences between the two groups.
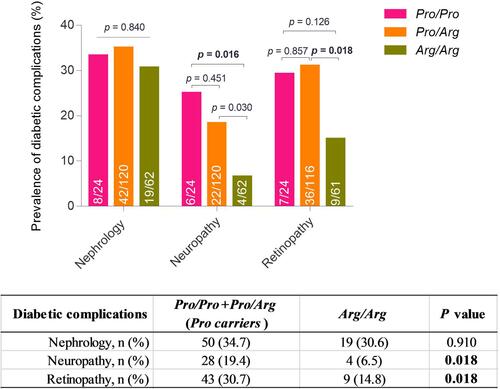
Figure 2 Association of the TP53 common polymorphism with mtDNA content in T2DM patients. Relative mtDNA content of the MT-ND1 (A) and MT-CO2 (B) indexes in leukocytes isolated from T2DM patients. Each solid circle represents one checked sample of the mtDNA content analysis. Lines across the scatter dot represent the median. p<0.01 versus the merged group of Pro/Pro and Pro/Arg genotypes, by Mann–Whitney test.
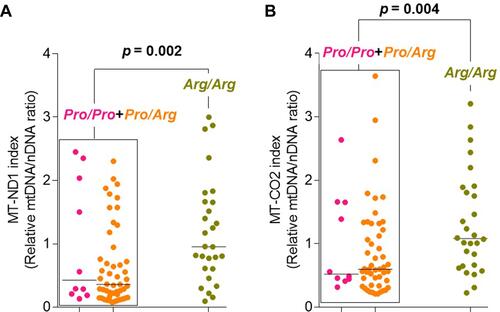
Figure 3 Representative result of ethidium bromide-stained agarose gel electrophoresis showed no abnormal mtDNA sequence deletion in mtDNA4977 deletion detection of leukocytes from T2DM patients. Genotypes of the TP53 Pro72Arg polymorphism and patient IDs are shown, respectively.
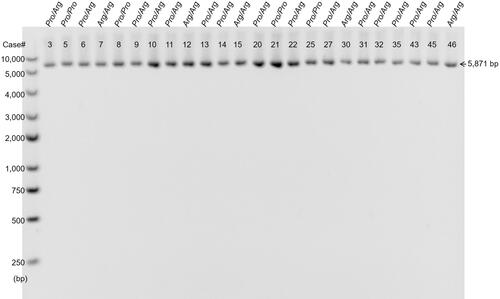
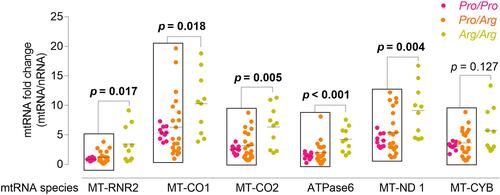
Figure 4 Association of the TP53 common polymorphism with mtRNA expressions in T2DM patients. Each solid circle represents one checked sample in RT-qPCR analysis. Lines across the scatter dot represent the median. The p values in bold type were significant differences between the Arg/Arg group and the merged group of Pro/Pro and Pro/Arg genotypes, by Mann–Whitney test.