
Figures & data
Table 1 Baseline Characteristics of the Study Population Based on eGFR (mL/Min/1.73m2)
Table 2 Univariate Cox Proportional Hazard Model of eGFR Levels for All-Cause Mortality (n = 199)
Table 3 Univariate Cox Proportional Hazard Model of eGFR Levels for MACE (n = 188)
Table 4 Multivariate Cox Proportional Hazard Model of Association of eGFR Levels with All-Cause Mortality and MACE
Figure 1 Kaplan-Meier curves of the cumulative incidence of all-cause mortality (A) and MACE (B) stratified by eGFR groups.
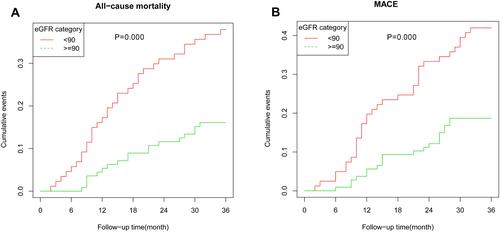
Table 5 Stratified Analysis by Sex of eGFR Levels with All-Cause Mortality and MACE by Sex