Figures & data
Table 1 The Characteristics of Clinical Indicators in EC with Early and Advanced Stage
Table 2 Univariate and Multivariate Logistic Regression Analyses for Stage
Figure 1 ROC curves of MCV, MCH, RDW-CV, CA125, CA199, CA153. P<0.05 suggests significantly different.
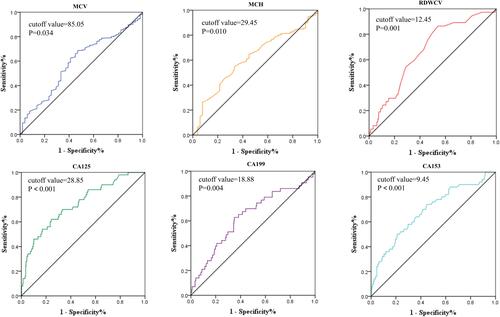
Table 3 Associations of RDW+CA125 with Clinical Characteristics
Table 4 Univariate and Multivariate Cox Proportional Hazards Regression Analyses for OS
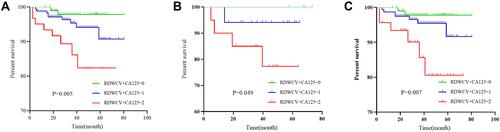
Figure 2 (A) Kaplan–Meier curve for OS of EC patients stratified by RDW-CV+CA125. (B) Association of RDW-CV+CA125 with the OS of EC patients with FIGO stage III–IV. (C) Association of RDW-CV+CA125 with the OS of EC patients with FIGO stage I–II. P<0.05 suggests significantly different.