Figures & data
Table 1 Baseline Characteristics of Patients with Type 2 Diabetes Mellitus
Table 2 Univariate Analysis of Factors Affecting IGF-1 SDS
Table 3 The Independent Association Between UA and IGF-1 SDS by Multivariate Piecewise Linear Regression
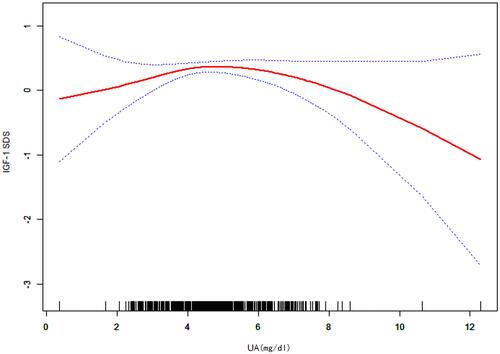
Figure 1 The relationship between UA and IGF-1 SDS. A threshold, nonlinear association between UA and IGF-1 SDS was found in a generalized additive model (GAM). Solid red line represents the smooth curve fit between variables. Dotted line represents the 95% of confidence interval from the fit. All adjusted for sex, age, duration of disease, BMI, TC, TG, HDL-C, LDL-C, Cr, FPG, HbA1c, HOMA-IR, hypoglycemic drugs.