Figures & data
Figure 1 The mRNA expression analysis of MTHFD2. (A) MTHFD2 expression profile across all tumor samples and normal tissues with dot plot. Red: MTHFD2 high expression in cancer tissues. Green: MTHFD2 low expression in cancer tissues. Black: No difference between tumor and normal tissues. Red box indicates LGG. (B) MTHFD2 differential expression in normal and LGG samples. Detailed MTHFD2 expression among LGG patients was assessed using GSE60898 dataset based on (C) Age, (D) BRAF genetic status, (E) Locations, (F) Primary or recurrent tumor, and (G) Primary tumor that further progressed.
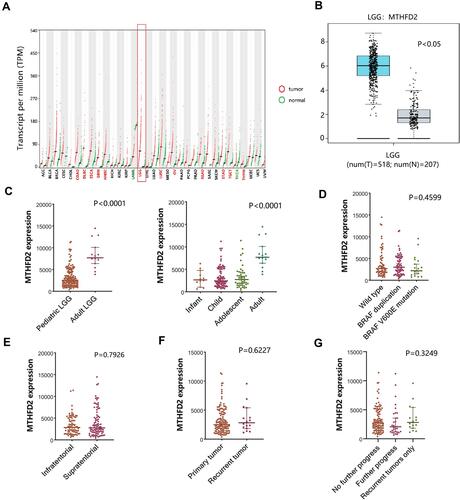
Table 1 The Clinical Characteristics of LGG Patients in TCGA Lower Grade Glioma (LGG) Cohort
Figure 2 The association analysis of MTHFD2 mRNA expression with clinical phenotypes of patients using TCGA-LGG data. (A) Age. (B) Gender. (C) Tumor subtypes. (D) IDH mutation status. (E) Pharmaceutical therapy. (F) Radiation therapy.
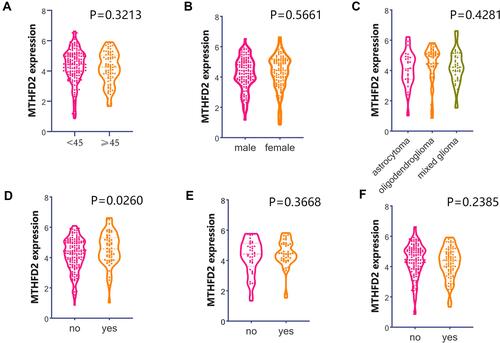
Figure 3 The MTHFD2 expression analysis. (A) Brain mRNA expression. (B) Representative immunohistochemical images of MTHFD2 in normal and LGG tissues. (C) Subcellular location of MTHFD2 protein in human and mouse cancer cells.
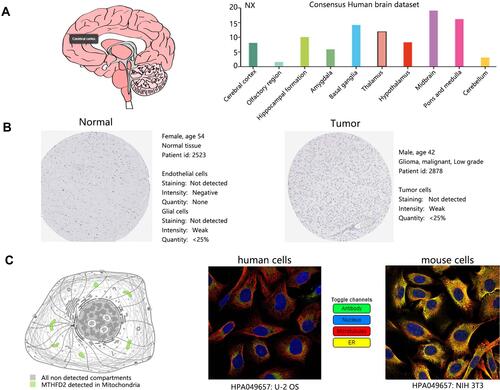
Figure 4 The association of MTHFD2 expression with overall survival of LGG patients.
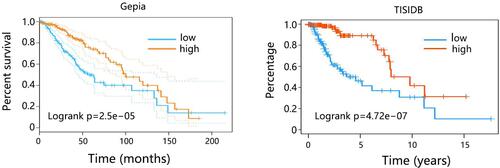
Table 2 Restrict Survival Analysis on LGG Patients in TCGA Lower Grade Glioma (LGG) Cohort
Table 3 Multivariate Cox Regression Analysis on LGG Patients
Figure 5 The enriched biological process of 175 co-expressed genes with MTHFD2.
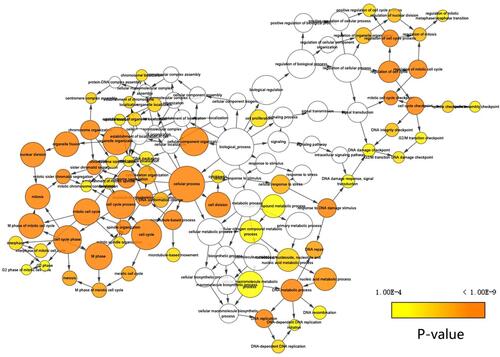
Figure 6 Potential enriched KEGG pathways of 175 co-expressed genes with MTHFD2. (A) The top 8 significant pathways. **P<0.01. (B) Interaction between pathway and related genes.
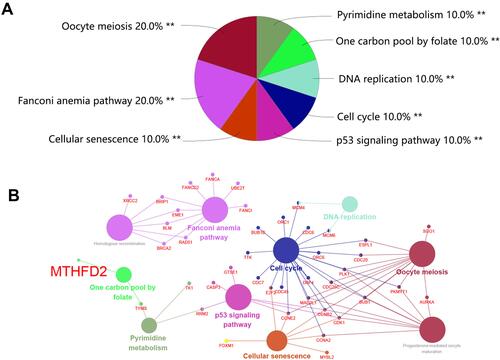
Figure 7 The GSEA analysis on MTHFD2 in LGG. (A) One carbon pool by folate pathway positively associated with MTHFD2. (B) Pathway plot of one carbon pool by folate pathway. The numbers mean the enzyme code (EC). For example, EC: 1.5.1.3 represents dihydrofolate reductase.
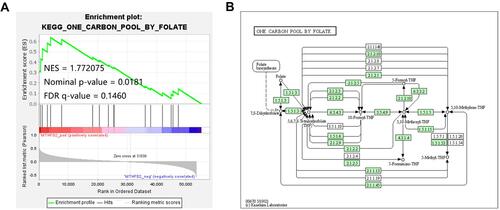
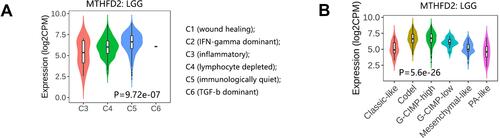
Figure 8 Tumor-immune system interaction analysis on MTHFD2. (A) Associations between MTHFD2 expression and immune subtypes in LGG. (B) Associations between MTHFD2 expression and molecular subtypes in LGG.