Figures & data
Figure 1 Volcano plots of differentially expressed lncRNA (A), miRNA (B) and mRNA (C) in AFP-negative HCC. Red dots indicate genes significantly upregulated and green indicates genes significantly downregulated.
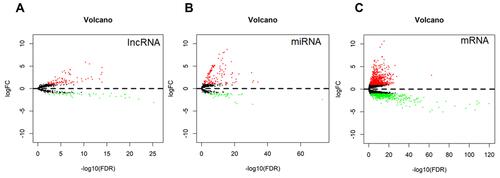
Table 1 12 DElncRNAs Target 23 DEmiRNAs from the miRcode Database
Figure 2 Venn diagram analysis for the intersection set between differentially expressed mRNA in AFP-negative HCC and miRNA target genes.
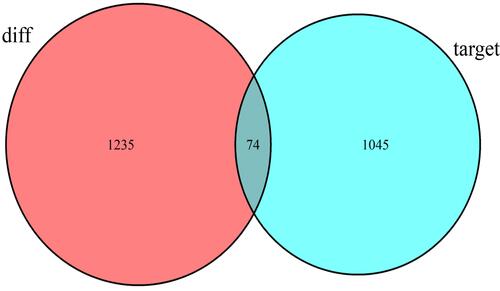
Figure 3 The lncRNA-miRNA-mRNA ceRNA network in AFP-negative HCC. The diamond represents lncRNA, the square represents miRNA and the circle denotes mRNA. The red nodes indicate upregulated RNAs and the green nodes indicate downregulated RNAs.
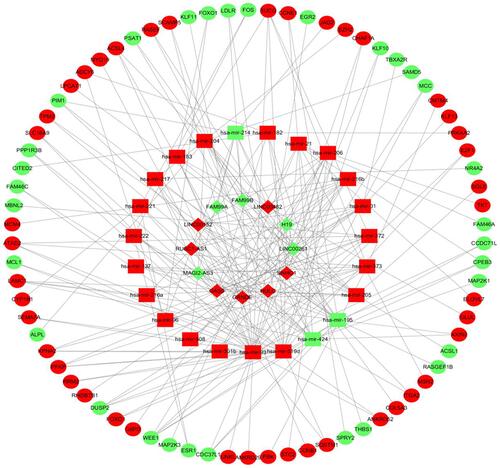
Figure 4 The GO enrichment analysis of DEmRNAs in the ceRNA network of AFP-negative HCC.
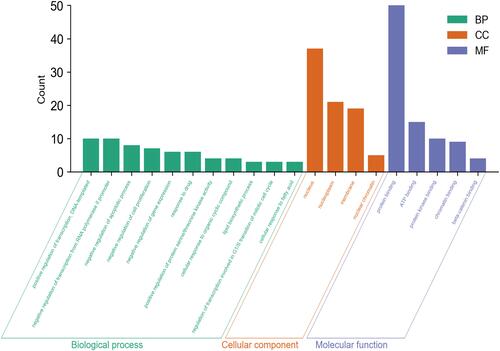
Figure 5 The enriched KEGG pathway of DEmRNAs in the ceRNA network of AFP-negative HCC.
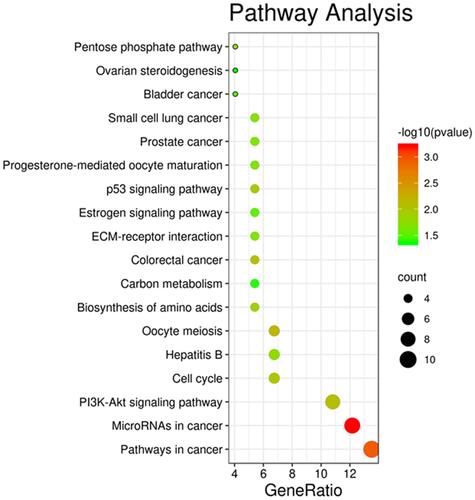
Figure 6 (A) A PPI network of DEmRNAs involved in the ceRNA network of AFP-negative HCC. Red nodes represent the upregulated DEmRNAs and green nodes represent the downregulated DEmRNAs. (B) The top ten highly interacted hub genes were recognized by cytoHubba.
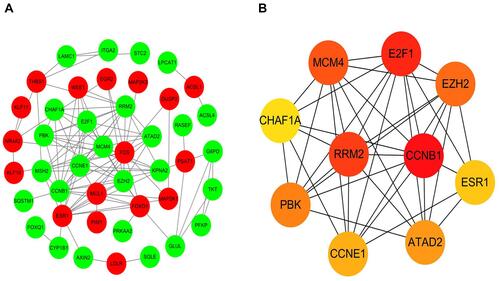
Figure 7 The ROC curves of the top ten hub genes. The AUC of CCNB1, E2F1, RRM2, MCM4, EZH2, PBK, ATAD2, CCNE1, ESR1, and CHAF1A were 0.954, 0.949, 0.916, 0.848, 0.962, 0.929, 0.816, 0.873, 0.920, and 0.928, respectively.
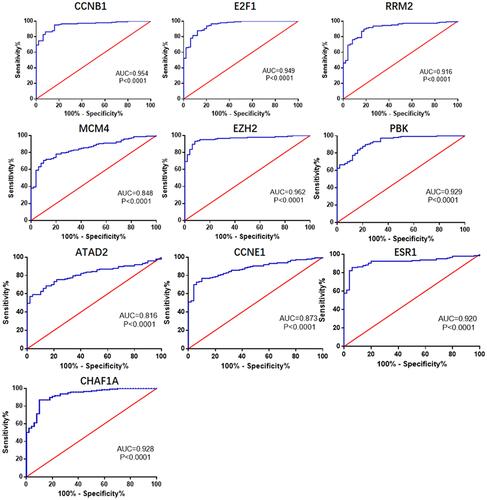
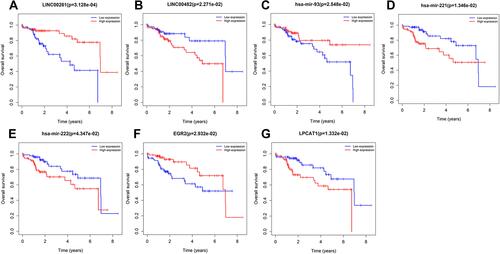
Figure 8 Kaplan–Meier survival curves of lncRNAs (A and B), miRNA (C–E), mRNA (F and G) associated with overall survival in AFP-negative HCC.