Figures & data
Figure 1 Workflow chart of the study.
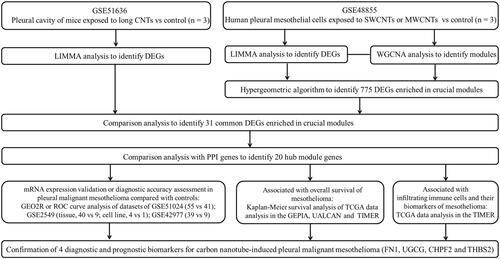
Table 1 Homologous Between CNT Exposure and Controls of Human and Mouse
Figure 2 Identification of DEGs between CNT-exposed and control human pleural mesothelial cells (MeT5A) in the GSE48855 dataset. (A), the heatmap of DEGs identified by comparing SWCNTs-exposed with dispersant-treated MeT5A cells; (B), the heatmap of DEGs identified by comparing MWCNTs-exposed with dispersant-treated MeT5A cells; (C), Venn diagram to screen the common upregulated genes between SWCNTs and MWCNTs; (D), Venn diagram to the common downregulated genes between SWCNTs and MWCNTs. The heatmap was generated based on the Z-score.
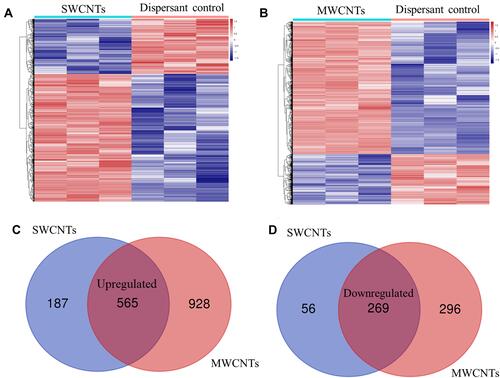
Table 2 Modules Based on WGCNA of Genes in the GSE48855 Dataset
Figure 3 Identification of key modules associated with CNT-induced malignant transformation of MeT5A cells by weighted gene co-expression network analysis. (A), calculation of the scale-free topology fit index according to different soft-threshold power values; (B), calculation of mean connectivity according to different soft-threshold power values; (C), a clustering dendrogram of samples; (D), the correlations between modules and disease status (r, correlation coefficient); (E), scatter plot of module eigengenes in the blue module; (F), scatter plot of module eigengenes in the brown module.
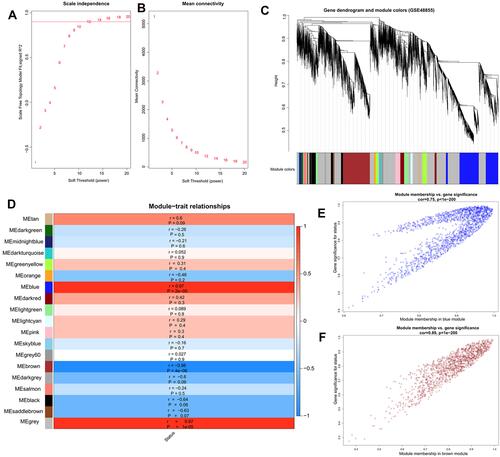
Figure 4 The protein–protein interaction network established by interaction pairs of four hub genes. Genes in circular represent hub genes. Gene color is corresponding to module color; regular triangle, upregulated genes; inverted triangle, downregulated genes.
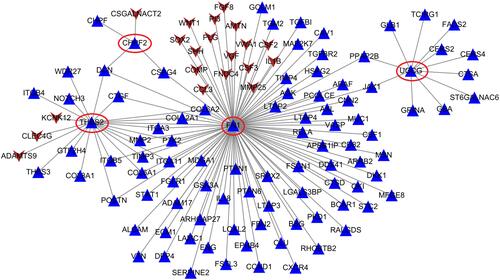
Figure 5 Kaplan-Meier survival curves for patients with a high and low expression of five hub module genes in mesothelioma samples. (A–E), GEPIA analysis results; F-J, TIMER analysis results. (A and F) for FN1; (B and G) for ALCAM; (C and H) for THBS2; (D and I) for UGCG; (E and J) for CHPF2.
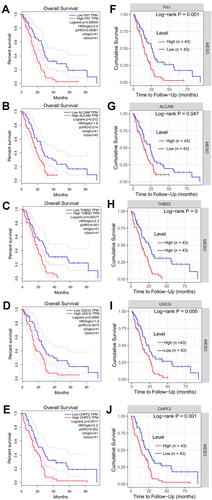
Table 3 Validation of the Expression of Hub Genes
Table 4 The Predictive Power of Hub Genes for MPM
Figure 6 ROC curves for evaluating the diagnostic values of four hub genes for distinguishing mesothelioma from normal patients. (A and B), ROC curves were plotted based on the mRNA expression levels of four genes in the GSE2549 dataset. (A), single gene; (B), gene-combination; (C and D), ROC curves were plotted based on the mRNA expression levels of four genes in the GSE51024 dataset. (C), single gene; (D), gene-combination; (E), ROC curve was plotted based on the mRNA expression levels of two genes in all mesothelioma samples of the GSE42977 dataset; (F), ROC curve was plotted based on the mRNA expression levels of three genes in the sarcomatoid and biphasic histological subtypes of the GSE42977 dataset.
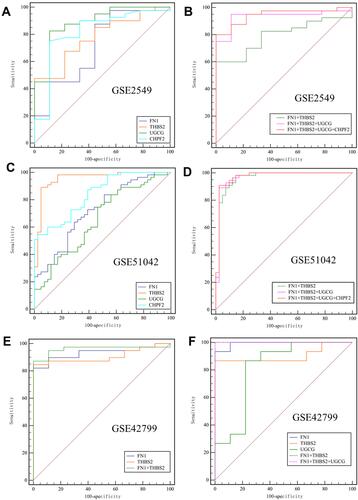
Table 5 Correlation Analysis Between Hub Genes and Markers of Immune Cells
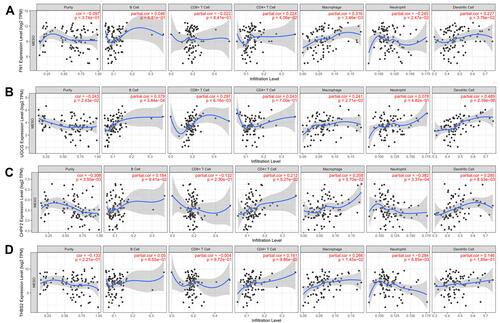
Figure 7 Correlations between the expression of hub genes and the abundance of six immune infiltration cells of mesothelioma. (A), FN1; (B), UGCG; (C), CHPF2; (D), THBS2.