Figures & data
Figure 1 The workflow of the present study.
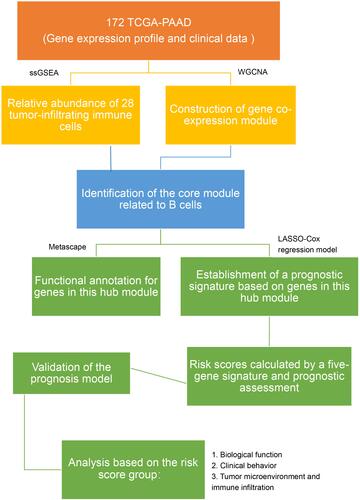
Figure 2 The heatmap of correlation among immune cells. Blue: positive correlation; red: negative correlation; size of circle: the stronger the correlation, the larger the circle and deeper colors.
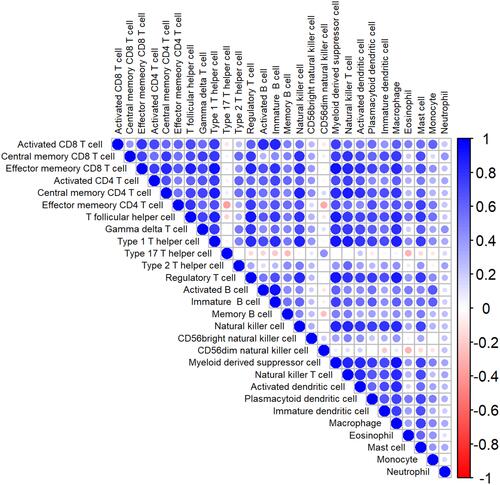
Figure 3 Identification of B cells closely related module. (A) Analysis of the scale-free fit index and mean connectivity for various soft-thresholding powers. The appropriate scale-free topology can be obtained at the soft-thresholding power of 6; (B) genes are grouped into divergent modules by hierarchical clustering. Different colors represented different modules and each color-marked module included a group of highly connected genes. A total of eight modules were identified; (C) heatmap of connection between module eigengenes and immune cell subsets; (D–F) scatterplots of Module Membership (MM) in the green module and Gene Significance (GS) for Activated B cells (D), immature B cells (E) and Memory B cells (F).
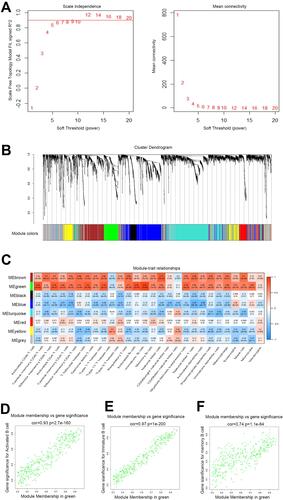
Figure 4 Functional annotation for genes in the green module. (A) The bar chart showed the top twenty enriched terms; (B) the network diagram was constructed with enriched terms as nodes and similarities as edges. Each color of nodes represented a various term.
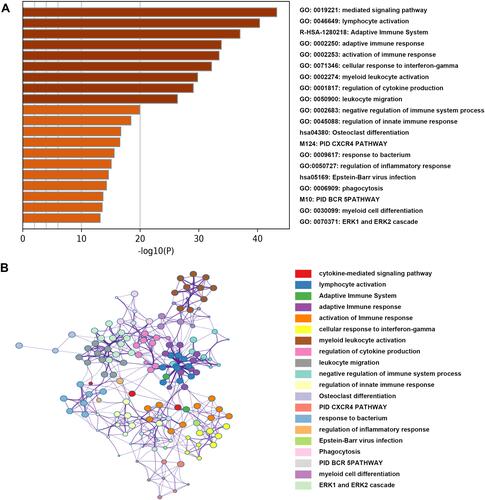
Table 1 Five Genes Identified from Cox Regression Analysis in the Training Set
Figure 5 Establishment of a five-gene prognostic signature in the training set. (A) Forest plot for visualizing the HRs of 18 genes with statistical significance after univariate COX analysis (p<0.05). Green: protective association; Red: risk factors; (B) LASSO coefficient profiles of the 18 genes; (C) the partial likelihood deviance plot showed the minimum value corresponds to the covariate used for multivariate Cox analysis.
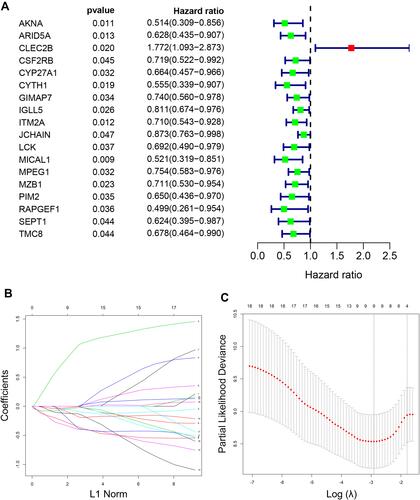
Figure 6 The five-gene signature predicts overall survival in PAAD. (A) The distribution of risk score, survival time and status, and expressions of these five genes; (B) Kaplan-Meier survival curves of high- and low-risk groups based on the five-gene signature; (C and D) the one-year (C) and three-year (D) ROC curves for survival prediction; (E) forest plot for visualizing independent prognostic effect analyses between the five-gene signature and commonly used prognostic factors utilizing multivariate Cox regression model.
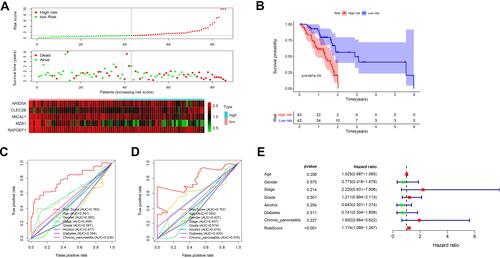
Figure 7 Survival and ROC curves for the five-gene signature in the validation and combined sets. (A and C) ROC curves for survival prediction based on the five-gene signature in the validation (A) and combined sets (C); (B and D) Kaplan–Meier plots for survival times in the validation (B) and combined sets (D).
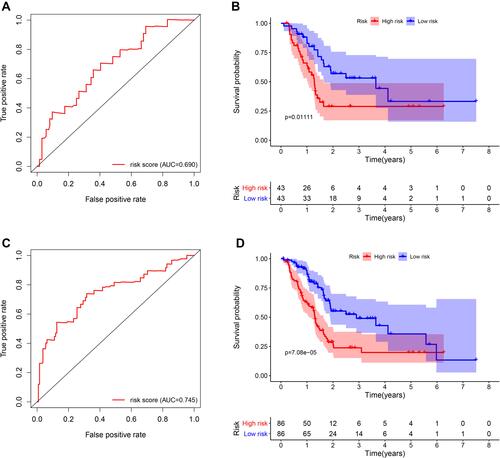
Table 2 Correlation Between Risk Scores and Clinicopathological Characteristics in PAAD Patients
Figure 8 Gene set enrichment analysis for the five-gene signature.
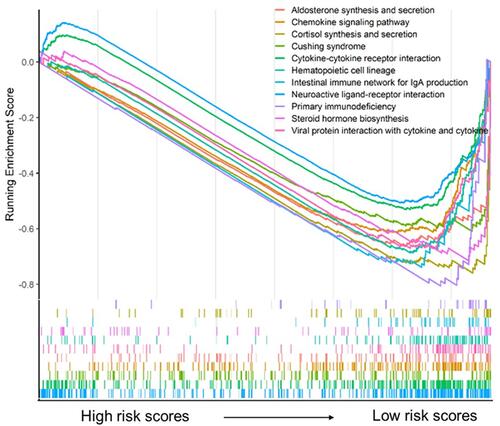
Figure 9 Analysis of tumor microenvironment for the five-gene signature. (A) The heatmap depicted the immune and stromal scores, tumor purity, also relative abundance of 28 immune cell subsets using ssGSEA and ESTIMATE method. (B–G) violin plots showed comparison between high- and low- risk group in the Immune scores (B), stromal scores (C), ESTIMATE scores (D), tumor purity (E), activated B cells (F), immature B cells (G).
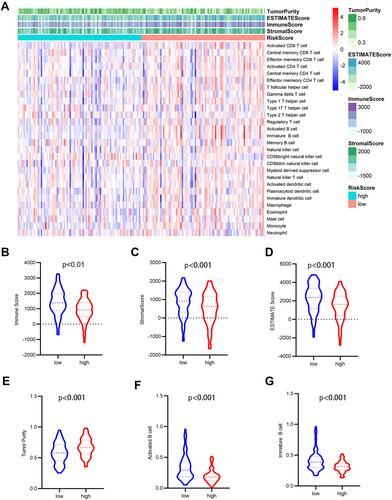
Figure 10 Higher risk scores in the male or high-grade patients. (A) Male patients had apparently higher risk scores; (B) high-grade patients presented obviously higher risk scores. *p < 0.05, **p < 0.01, ***p < 0.001.
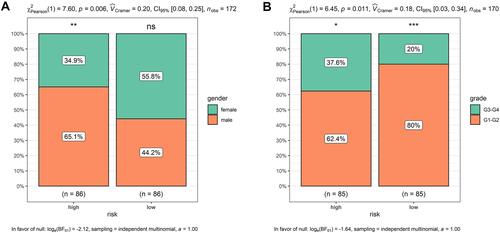
Figure 11 Association between the five genes in the prognostic signature and immune cell subsets based on different databases. (A) Heatmap of correlation between the five genes and twenty-eight immune cells from the TISIDB database. Blue: Positive correlation; Yellow: negative correlation; Size circle: the stronger the correlation, the larger the circle. (B–F) relevance between expressions of these five genes and B cells using MCPcounter. (G–K) relevance between expressions of these five genes and B cells using EPIC.
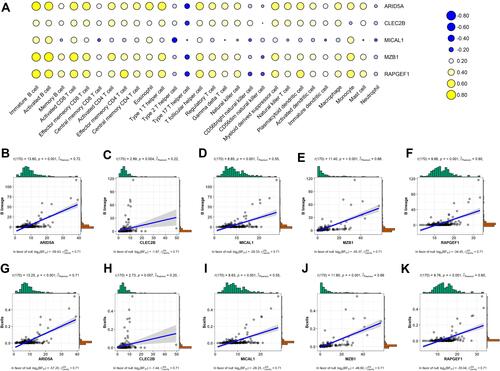
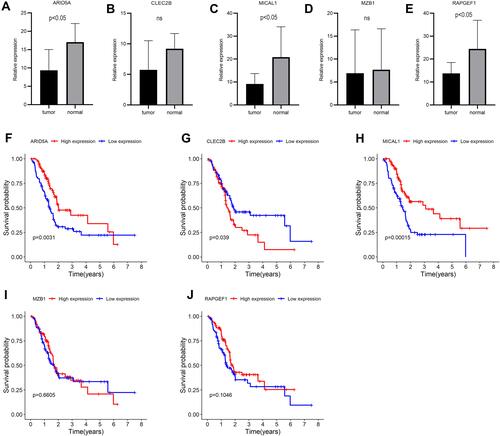
Figure 12 Expressions and survival curves of the five genes of the prognostic signature in PAAD. (A–E) Expressions of the five genes in PAAD and adjacent-normal tissues: (A) ARID5A, (B) CLEC2B, (C) MICAL1, (D) MZB, (E) RAPGEF1; (F–J) Survival analysis of the five genes: (F) ARID5A, (G) CLEC2B, (H) MICAL1, (I) MZB1, (J) RAPGEF1.