Figures & data
Table 1 Clinical Parameters of Liver Transplant Recipients with Diagnosis of NODM and without NODM
Table 2 Clinical and Preoperative Laboratory Test Parameters of DCD & LDLT Donor
Table 3 Risk Factors of NODM in Multivariate Logistic Regression Analysis
Figure 1 Constructed Logistic regression model was used to predict the test set and construct the ROC chart. It can be seen from the figure that AUC=0.868, 95% CI: 0.745, 0.992, indicating that the prediction effect of the model is excellent.
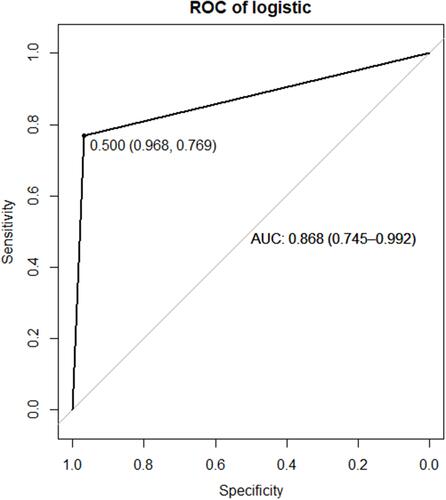
Figure 2 (A) The IL-6 levels of NO-NODM group in NODM combination after liver transplantation, the inner lines represent the median, the bars represent the 25% and 75% confidence intervals, and the error bars represent the 5% and 95% confidence intervals. (B) The PCT levels of NO-NODM group in NODM combination after liver transplantation, the inner lines represent the median, the bars represent the 25% and 75% confidence intervals, and the error bars represent the 5% and 95% confidence intervals. (C) The CRP levels of NO-NODM group in NODM combination after liver transplantation, the inner lines represent the median, the bars represent the 25% and 75% confidence intervals, and the error bars represent the 5% and 95% confidence intervals.
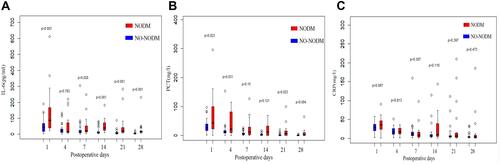
Figure 3 The TAC plasma concentration of NO-NODM group in NODM combination after liver transplantation, the inner lines represent the median, the bars represent the 25% and 75% confidence intervals, and the error bars represent the 5% and 95% confidence intervals.
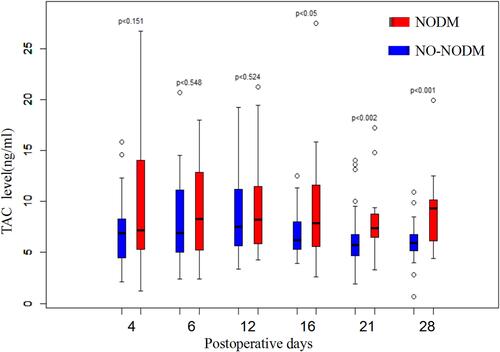
Figure 4 The FBG levels of NO-NODM group in NODM combination after liver transplantation, the inner lines represent the median, the bars represent the 25% and 75% confidence intervals, and the error bars represent the 5% and 95% confidence intervals.
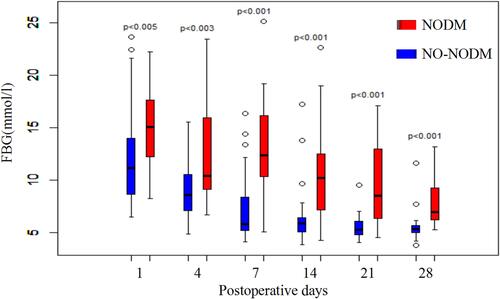
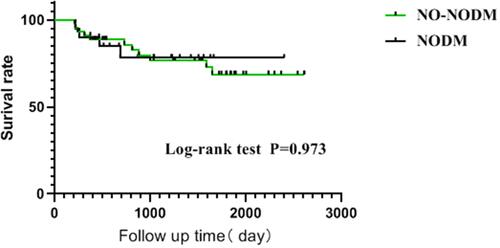
Figure 5 Kaplan-Meier survival curve analysis of 2 group.