Figures & data
Figure 1 Flow chart of cases selection.
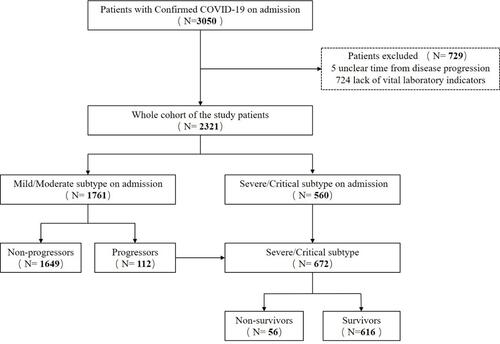
Table 1 Clinical Characteristics of Mild/Moderate COVID-19 Patients on Admission
Table 2 Clinical Features of Severe/Critical COVID-19 Patients
Table 3 Laboratory Finding and CT Imaging of Mild/Moderate COVID-19 Patients on Admission
Table 4 Laboratory Finding of Severe/Critical COVID-19 Patients
Table 5 Univariate and Multivariate COX Analysis of Progression of Mild/Moderate COVID-19
Table 6 Univariate and Multivariate COX Analysis of Survival of Severe/Critical COVID-19
Figure 2 Nomogram predicting 20-day, 40-day, 60-day, and 80-day progression probability of patients with non-severe COVID-19.
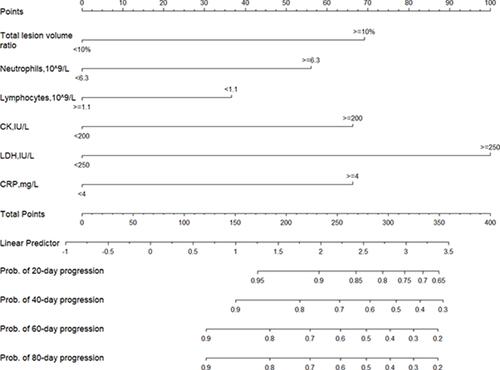
Figure 3 Kaplan–Meier curves of risk group stratification for non-progression to severe illness. (A) The cutoffs of neutrophils for each risk group were as follows: low risk: <6.3, and high risk: ≥6.3. (B) The cutoffs of lymphocytes for each risk group were as follows: low risk: ≥1.1, and high risk: <1.1. (C) The cutoffs of CK for each risk group were as follows: low risk: <200, and high risk: ≥200. (D) The cutoffs of LDH for each risk group were as follows: low risk: <250, and high risk: ≥250. (E) The cutoffs of CRP for each risk group were as follows: low risk: <4, and high risk: ≥4. (F) The cutoffs of total lesion volume ratio for each risk group were as follows: low risk: <10%, and high risk: ≥10%.
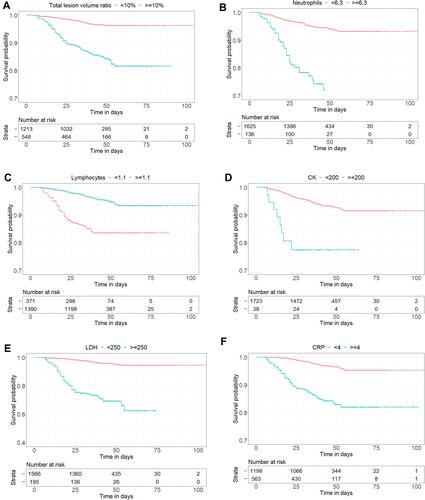
Figure 4 Risk score for progressor. Scores ranged from 0 to 6, with 0 indicating the lowest risk and 6 being the highest risk of progression. The numbers in the bar indicate the number of patients in the NP (red) and P (green) that were correctly predicted in the dataset.
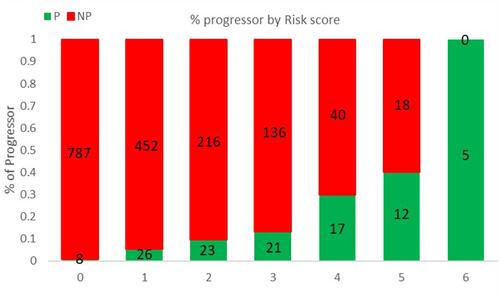
Figure 5 Nomogram predicting 20-day, 40-day, 60-day, and 80-day survival probability of patients with COVID-19.
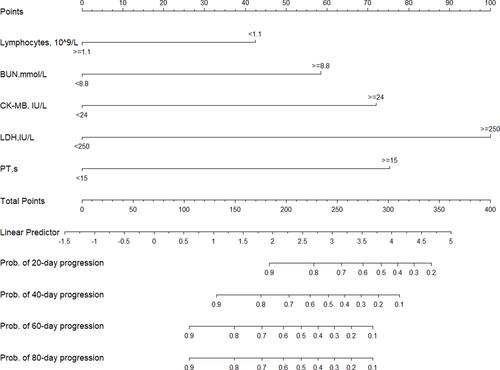
Figure 6 Kaplan–Meier curves of risk group stratification for survival probability. (A) Lymphocytes: low risk: ≥1.1, and high risk: <1.1. (B) BUN: low risk: <8.8, and high risk: ≥8.8. (C) CK-MB: low risk: <24, and high risk: ≥24. (D) LDH: low risk: <250, and high risk: ≥250. (E) PT: low risk: <15, and high risk: ≥15.
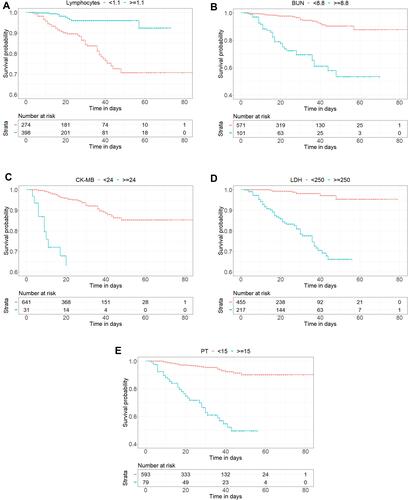
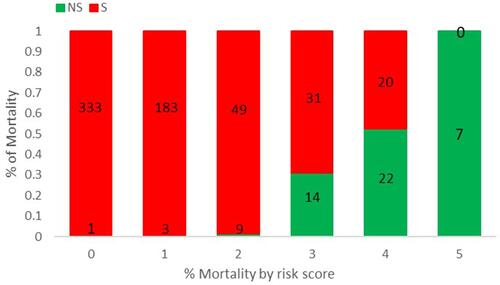
Figure 7 Risk score for mortality. Scores ranged from 0 to 5, with 0 indicating the lowest risk and 5 being the highest risk of mortality. The numbers in the bar indicate the number of patients in the S (red) and NS (green) that were correctly predicted in the dataset.