Figures & data
Table 1 Clinical Information of Samples
Figure 1 Work flow chart.
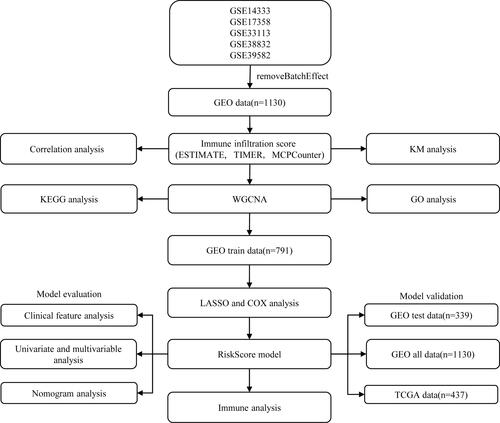
Figure 2 Immunoinfiltration analysis. (A) PCA analysis of five datasets prior to elimination of batch effect. (B) PCA analysis of five datasets after elimination of batch effect. (C) KM curves of StromalScorehigh group and StromalScorelow groups in the merged GEO dataset. (D) KM curves of ESTIMATEScorehigh group and ESTIMATEScorelow groups in the merged GEO dataset. (E) KM curves of ImmuneScorehigh group and ImmuneScorelow groups in the merged GEO dataset. (F) Correlation analysis of immune scores.
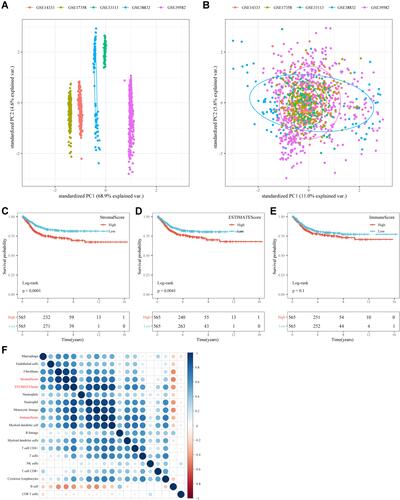
Figure 3 WGCNA. (A) Cluster analysis of merged GEO dataset samples. (B) Analysis of network topology for various soft-thresholding powers. (C) Gene dendrogram and module color. (D) Correlations between the 18 modules and immune scores.
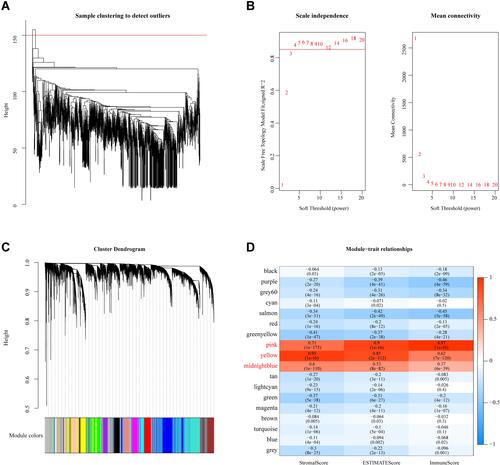
Figure 4 Functional enrichment analysis. (A) Gene Ontology (GO) functional annotation of pink module genes. (B) Kyoto Encyclopedia of Genes and Genomes (KEGG) pathway annotation of pink module genes. (C) GO functional annotation of yellow module genes. (D) KEGG pathway annotation of yellow module genes. (E) GO functional annotation of the midnight blue module genes. (F) KEGG pathway annotation of the midnight blue module gene.
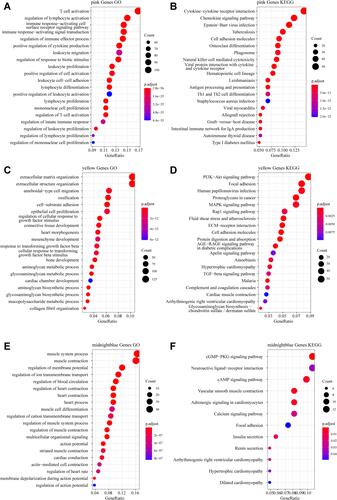
Table 2 Multivariate Cox Analysis of Risk Models
Figure 5 (A and B) The distribution of RiskScore and corresponding survival states in the Gene Expression Omnibus (GEO) training dataset. (C) Heatmap of gene expression in the RiskScore model. (D and E) Kaplan-Meier curve and receiver operating characteristic curve of RiskScore in the GEO training dataset.
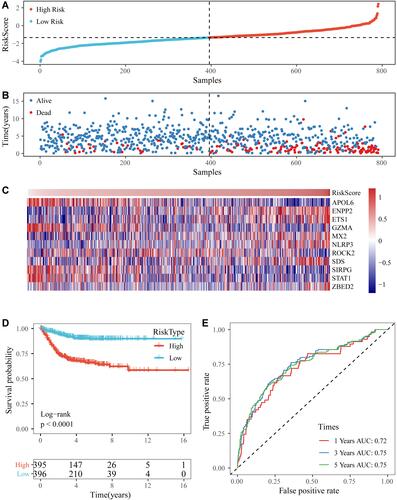
Figure 6 (A) The distribution of RiskScore and corresponding survival states in the Gene Expression Omnibus (GEO) validation dataset, and heatmap of gene expression in RiskScore model. (B and C) Kaplan-Meier (KM) curve and receiver operating characteristic (ROC) curve of RiskScore in GEO validation dataset. (D) The distribution of RiskScore and corresponding survival states in the entire merged GEO dataset, and heatmap of gene expression in RiskScore model. (E and F) KM curve and ROC curve of RiskScore in the entire merged GEO dataset.
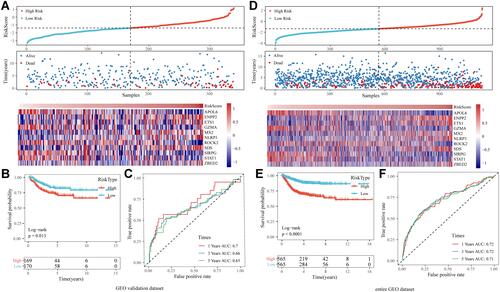
Figure 7 (A) Comparison of RiskScore among T1-4 Stage groups in the merged Gene Expression Omnibus (GEO) dataset. (B) Comparison of RiskScore among N1-4 stage groups in the merged GEO dataset. (C) Comparison of RiskScore between M0 and M1 stage groups in the merged GEO dataset. (D) Comparison of RiskScore among stage I-IV groups in the merged GEO dataset. (E) Comparison of RiskScore among grade 1–3 groups in the merged GEO dataset.
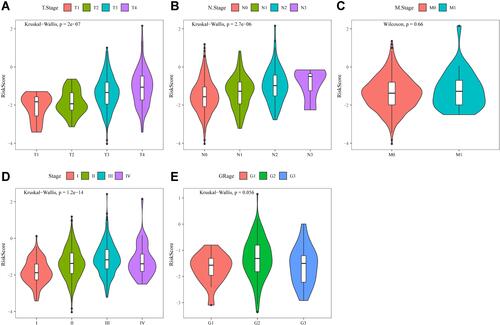
Figure 8 (A) T stage distribution between high- and low-risk groups in the merged Gene Expression Omnibus (GEO) dataset. (B) N stage distribution between high- and low-risk groups in the merged GEO dataset. (C) M stage distribution between high- and low-risk groups in the merged GEO dataset. (D) Stage distribution between high- and low-risk groups in the merged GEO dataset. (E) Relapse status distribution between high- and low-risk groups in the merged GEO dataset. (F) Grade stage distribution between high- and low-risk groups in the merged GEO dataset. (G) Age distribution between high- and low-risk groups in the merged GEO dataset. (H) Gender distribution between high- and low-risk groups in the merged GEO dataset.
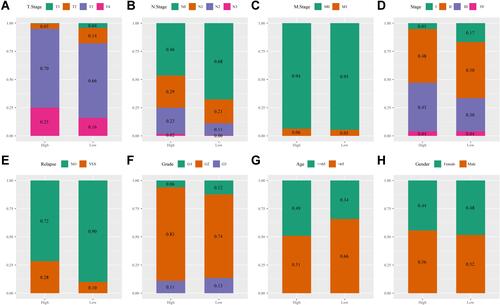
Figure 9 (A) Comparison of differences in ESTIMATE immunization scores in high- and low-risk groups in the merged Gene Expression Omnibus (GEO) dataset. (B) Differential expression of immunotherapeutic genes in high- and low-risk subgroups in the merged GEO dataset. (C) Analysis of the correlation between immune scores and immunotherapeutic genes in the merged GEO dataset. (D) Comparison of differences in ESTIMATE immunization scores in high- and low-risk groups in The Cancer Genome Atlas (TCGA) dataset. (E) Differential expression of immunotherapeutic genes in high- and low-risk subgroups in the TCGA dataset. (F) Analysis of the correlation between immune scores and immunotherapeutic genes in the TCGA dataset. *P<0.05, **P<0.01, ***P<0.001, ****P<0.0001, ns, not significant.
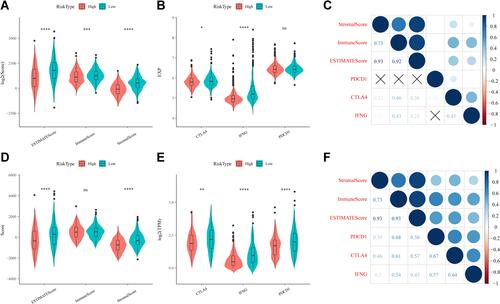
Table 3 Univariate and Multivariate Survival Cox Analysis of RiskScore in Merged GEO Datasets
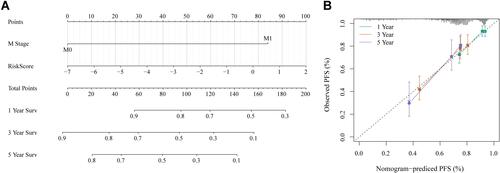
Figure 10 (A) Nomogram of RiskScore and M stage. (B) Calibration diagram of the nomogram.