Figures & data
Table 1 Results of Univariate and Multivariate Cox Regression Analysis
Figure 1 NDC1 was upregulated in colon cancer tissue. (A) NDC1 was upregulated in tumor compared with paired samples. (B) NDC1 was upregulated in colon cancer cohort. (**p < 0.01, ****p < 0.001).
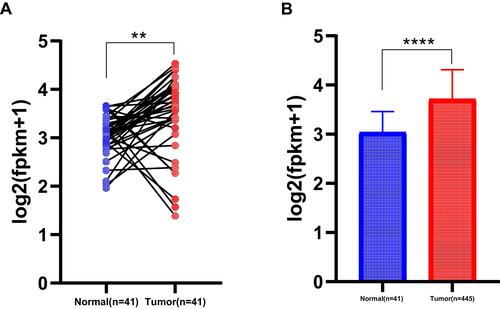
Figure 2 With tumor stage increasing, the expression of NDC1 was decreased. (A) The expression of NDC1 in stage III and IV was higher than stage I and II. (B) NDC1 was decreased in T3 and T4 stage compared with Tis, T1 and T2. (C) NDC1 was down-regulated in N1 and N2 compared with N0. (D) The expression of NDC1 in M stage also showed similar trend. (*p < 0.05, **p < 0.01).
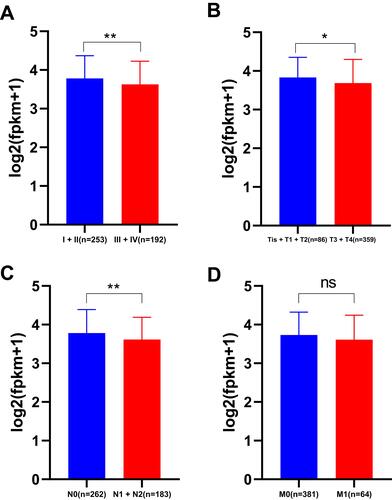
Figure 3 NDC1 was prognosis biomarker of survival. (A) Colon cancer patients were divided into two groups. Patients with higher expressed NDC1 had better survival. (B) The nomogram was showed for colon cancer with NDC1 as clinical factor.
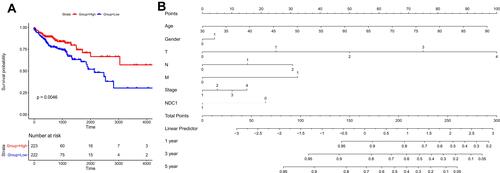
Figure 4 The expression level of NDC1 was correlated with immune cells, B cell (r = 0.246, p = 5.38e-7), CD8+ T cell (r = 0.299, p = 7.38e-10), CD4+ T cell (r = 0.16, p = 1.33e-3), Macrophage (r = 0.406, p = 2.40e-17), Neutrophil (r = 0.406, p = 2.40e-17) and Dendritic cell (r = 0.34, p = 2.34e-12) (A–F).
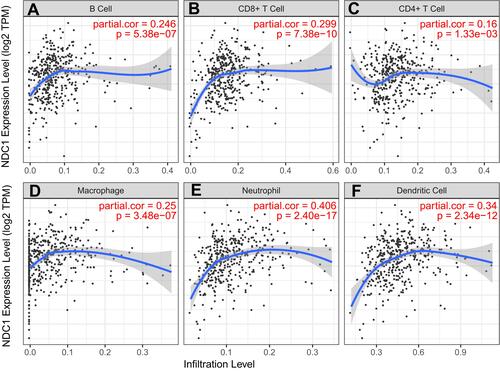
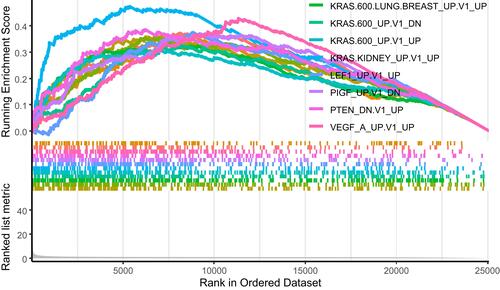
Figure 5 GSEA analysis revealed NDC1 was involved many import pathways. Top 8 pathways were graphed.