
Figures & data
Figure 1 The flow diagram on the study population selection and evaluation.
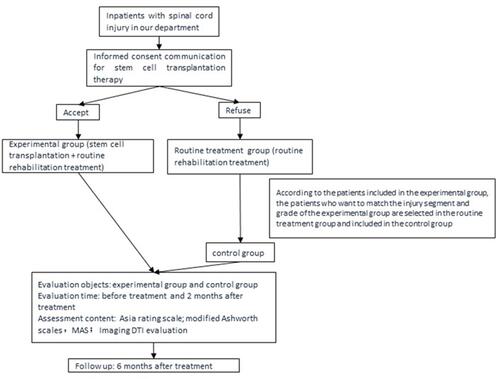
Figure 2 Positioning site of ROI. (A) T1WI image; (B) FA image. TIWI showed FA was a DTI scalar, representing axon integrity and closely related to fiber integrity.
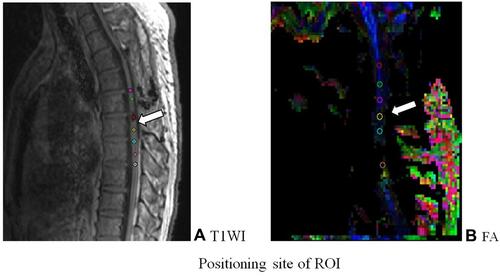
Figure 3 The cell morphology under 4x microscope for the fourth generation cells.
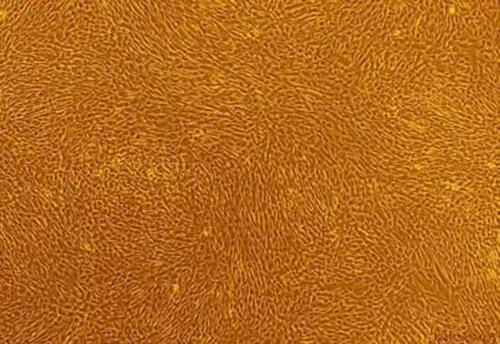
Table 1 General Information of Patients
Table 2 Comparison of Spasticity and Urination and Defecation in the Experimental and Control Groups Before and 2 Months After Treatment
Table 3 Comparison of ASIA Scores in the Experimental Group of Patients Before and After Treatment (±s)
Table 4 Comparison of the ASIA Scores Before and After Treatment
Figure 4 The FA image and the ADC image in a patient with complete cervical SCI. (A) FA image before the treatment; (B) FA image after the treatment; (C) ADC image before the treatment; (D) ADC image after the treatment. After scanning, DTI images were transmitted to Siemens workstation for post-processing to generate sagittal DTI images of spinal cord, including ADC and FA images. In the zoom and 3D mode of DTI post-processing window, ROI of the same size (about 2 ~ 3 pixels) was placed in the center of the spinal cord lesion area at the selected spinal cord level, and the ADC value and FA value were measured.
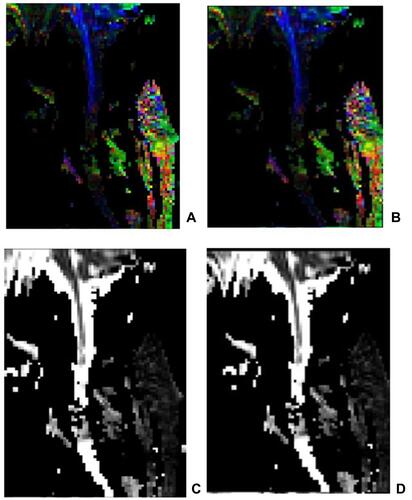
Figure 5 The FA image and the ADC image in a patient with incomplete thoracic SCI (A) FA image before the treatment; (B) FA image after the treatment; some green or red abnormal signal opacities could be observed in the blue spinal cord without interruption of the blue spinal cord. (C) ADC image before the treatment; (D) ADC image after the treatment. A partially increased signal and light gray or white changes without an interruption signal could be observed in the ADC image.
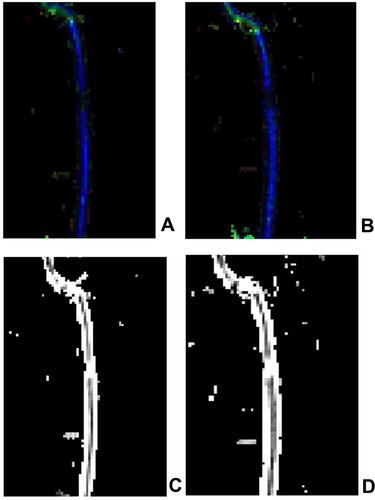
Table 5 Comparison of Lesion Levels in Experimental and Control Patients Before and After Transplantation (±S) ADC(
±s×10−6 mm2/S) FA(
±s×10−3)
Table 6 Comparison of the Difference Between Lesion Level and Normal Level in the Experimental Group of Patients Before and After Transplantation (M±Q) ADC(M±Q×10−6 mm2/S)FA(M±Q×10−3)