Figures & data
Table 1 Comparisons of Clinical Characteristics Among COVID-19 Patients
Figure 1 Study population.
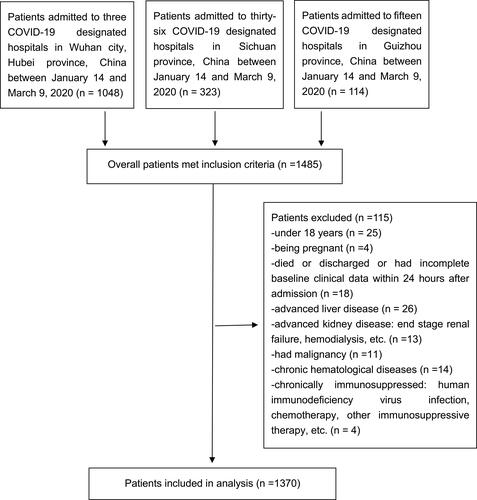
Figure 2 (A) The BUN, albumin and BAR values within 24 hours after admission in COVID-19 patients with or without critical illness. (B) Comparisons of the rates of critical illness among quartiles of BAR in COVID-19 patients. P values were calculated by Chi Square analysis.
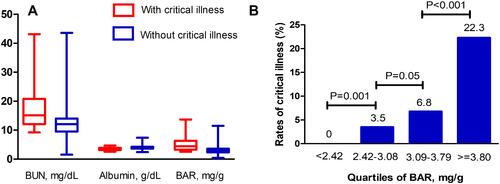
Figure 3 (A) ROC curve of BAR, BUN, albumin and CURB-65 for prediction of critical illness in COVID-19 patients. The AUC were 0.821 (95% CI: 0.784, 0.858; P<0.01) for BAR, 0.783 (95% CI: 0.743, 0.823; P<0.01) for BUN, 0.712 (95% CI: 0.664, 0.760; P<0.01) for albumin, and 0.744((95% CI: 0.690, 0.798; P<0.01) for CURB-65, respectively. The optimal predictive cut-off value of BAR was 3.7887 mg/g (specificity: 0. 690; sensitivity: 0.786). (B) Subgroup analysis for OR of COVID-19 patients with BAR ≥ 3.7887 mg/g versus BAR < 3.7887 mg/g stratified by area, age, sex, history of drinking or smoking, and comorbidity. P values were calculated by multivariate Logistics regression analysis.
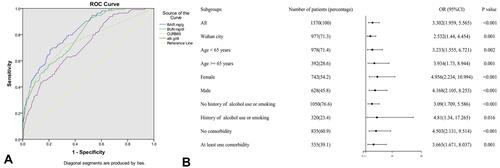
Figure 4 Predictive nomogram for critical illness in COVID-19 patients. Age (years); Unconsciousness (1: yes, 0: no); Respiratory rate (breath/min); Lymphocyte (×109/L); Total bilirubin (μ mol/L); BAR (mg/g).
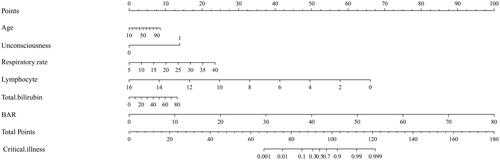
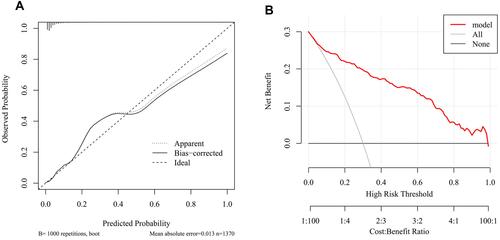
Figure 5 (A) The calibration curve of nomogram. (B) The DCA of nomogram.