Figures & data
Figure 1 Study flow chart.
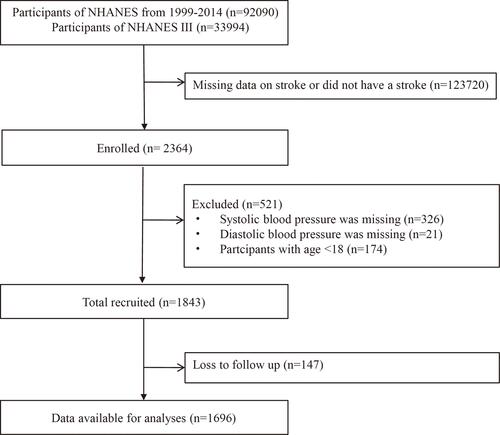
Table 1 Characteristics of the Study Population by Systolic Blood Pressure Categories
Table 2 Characteristics of the Study Population by Diastolic Blood Pressure Categories
Table 3 Univariate COX Regression Analysis of Predictors for Mortality
Table 4 Adjusted Hazard Ratios (95% Confidence Intervals) for All-Cause Mortality
Figure 2 Kaplan–Meier survival curves illustrating the rate of all-cause mortality according to SBP categories (A) and DBP categories (B).
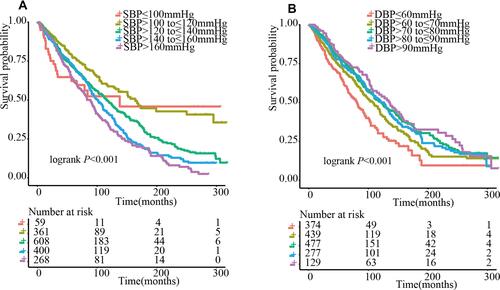
Figure 3 Restricted cubic spline plots of the association between blood pressure and risk of death. (A) SBP: all cause mortality; (B) DBP: all cause mortality; (C) SBP: cardiovascular and cerebrovascular mortality; (D) DBP: cardiovascular and cerebrovascular mortality.
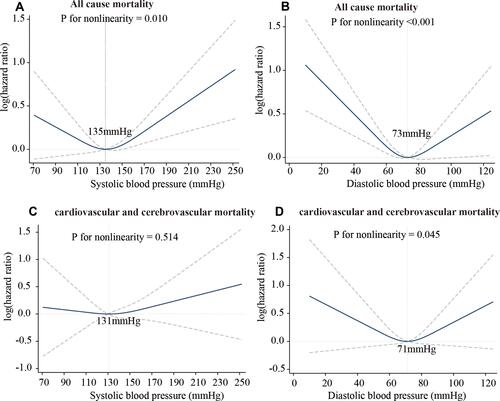
Table 5 Stratified Associations Between Systolic Blood Pressure and Mortality by Age, Sex and BMI
Table 6 Stratified Associations Between Diastolic Blood Pressure and Mortality by Age, Sex and BMI
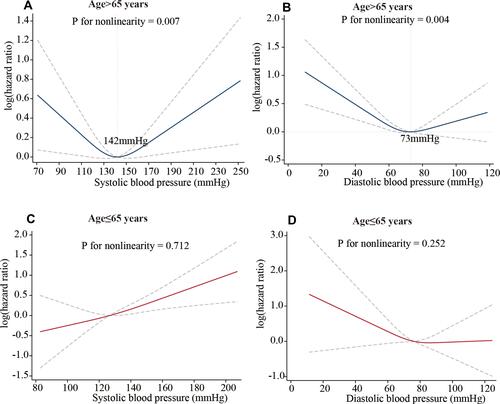
Figure 4 Restricted cubic spline plots of the association between blood pressure and all-cause mortality in different age groups. (A) SBP: age > 65 years; (B) DBP: age > 65 years; (C) SBP: age ≤ 65 years; (D) DBP: age ≤ 65 years.