Figures & data
Figure 1 Comparisons of adaptive immune cells between HCC and normal tissues. Median with 95% confidence interval were shown as red lines. (A) naive B cells; (B) memory B cells; (C) plasma cells; (D) total B cells; (E) CD8+ T cells; (F) naive CD4+ T cells; (G) resting CD4+ memory T cells; (H) activated CD4+ memory T cells; (I) follicular helper T cells; (J) regulatory T cells; (K) gamma delta T cells; (L) total T cells. *P<0.05; **P<0.001.
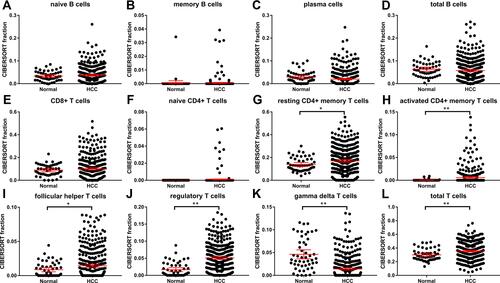
Figure 2 Comparisons of innate immune cells between HCC and normal tissues. Median with 95% confidence interval were shown as red lines. (A) resting NK cells; (B) activated NK cells; (C) monocytes; (D) M0 macrophages; (E) M1 macrophages; (F) M2 macrophages; (G) resting dendritic cells; (H) activated dendritic cells; (I) resting mast cells; (J) activated mast cells; (K) eosinophils; (L) neutrophils. *P<0.05; **P<0.001.
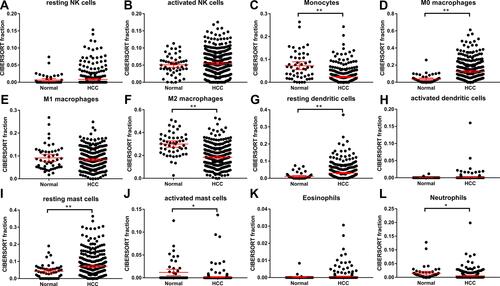
Table 1 Fraction of Immune Cells
Figure 3 (A) A bar plot of the fractions of 22 types of immune cells in HCC and normal control tissues; (B) a heatmap of 22 types of immune cells in HCC and normal control tissues; (C) a correlation heatmap of 22 types of immune cells in HCC tissues.
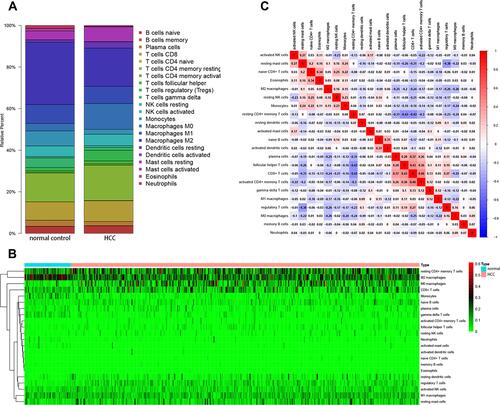
Table 2 Patient Baseline and Tumor Characteristics
Figure 4 Kaplan-Meier curves of follicular helper T cells (A), monocytes (B), M0 (C) and M2 macrophages (D) for overall survival in HCC patients.
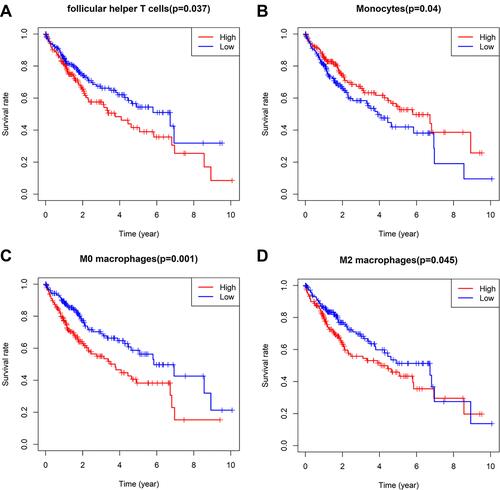
Figure 5 Differences of the fraction of follicular helper T cells, monocytes, M0 and M2 macrophages in each histological grade (A–D) and clinical stage (E–H) of HCC.
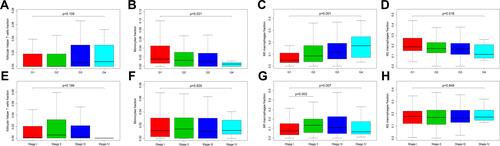
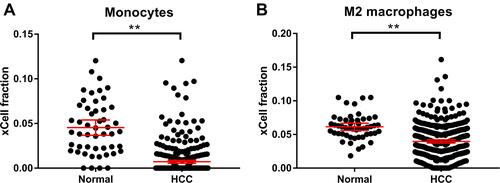
Figure 6 Comparisons of monocytes (A) and M2 macrophages (B) between HCC and normal tissues using xCell. Median with 95% confidence interval were shown as red lines. **P<0.001.