
Figures & data
Figure 1 Gastric cancer subtypes with different immune cell infiltration and hypoxia status. (A) Unsupervised clustering of 36 gene sets related to hypoxia or Immune cell infiltration in GC metacohort including the 5 independent stomach cancer cohorts. Each column represented patients and each row represented the enrichment scores for these gene sets. The clinical information collated serves as the patient’s annotation. Differences in stromal scores (B), immune score (C) and estimate score (D) between different HIcluster. The Kruskal–Wallis test was used to compare the statistical difference between HIcluster. (E) The component differences of immune cells among the three HIcluster analyzed by CIBERSORT. Differences in PD-L1 (F) and CTLA4 expression (G) among three HIclusters in GC metadata. The Kruskal–Wallis test was used to compare the statistical difference. (***p < 0.001.).
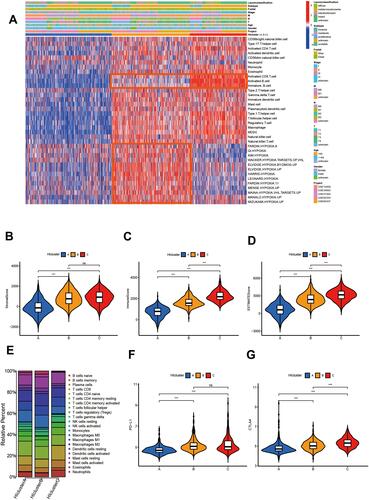
Figure 2 Identify different genomic subtypes in ACRG cohort. (A) Consensus matrices of the ACRG cohort for k = 3. (B) Unsupervised clustering of overlapping hypoxia-immune-related genes in ACRG cohorts to classify patients into different genomic subtypes (genecluster A–C). The geneclusters, HIclusters, molecular subtypes, stage, gender, survival status and age were utilized as patient annotations. (C) Survival analyses for the three geneclusters in ACRG cohort including 132 cases in gencluster A, 116 cases in genecluster B, and 52 cases in genecluster C. Kaplan–Meier curves with Log rank p value< 0.001 showed a significant survival difference among three geneclusters. Genecluster C showed significantly worse OS than the other two genclusters.
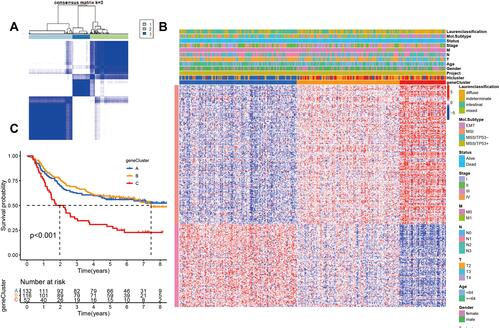
Table 1 Clinicopathological Characteristics in Relation to Different HIgeneclusters in ARCG Cohorts
Figure 3 The proportion of Lauren-classifications (A) and ACRG molecular subtypes (B) in the three geneclusters. The proportion of ACRG molecular subtypes in different T stages (C) and tumor stages (D). (E) Difference in the expression of 21 known biological processes related to tumor progression among three geneclusters. The upper and lower ends of the boxes represented interquartile range of values. The lines in the boxes represented median value, and black dots showed outliers. The asterisks represented the statistical p value (****P < 0.0001).
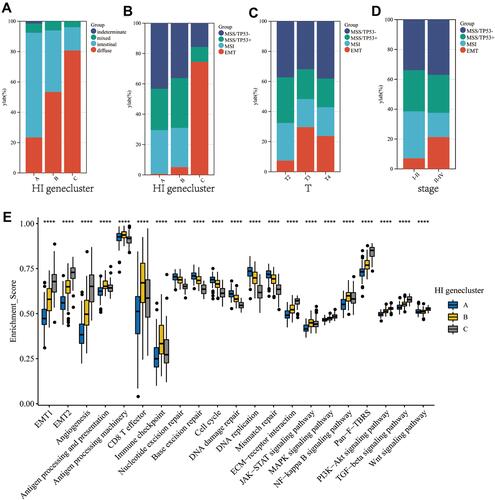
Figure 4 Immune cell infiltration characteristics and transcriptome traits in different group with high or low HIscore. (A) The abundance of each TME infiltrating cell in high and low HIscore groups. (B) Difference in the expression of 18 hypoxia gene signatures between high and low HIscore groups. The asterisks represented the statistical p value (Wilcox test, *P < 0.05; **P < 0.01; ***P < 0.001). (C) Differences in HIscore among three geneclusters in ACRG cohort. The Kruskal–Wallis test was used to compare the statistical difference between three geneclusters (P < 0.0001). (D) Differences in HIscore between different ACRG molecular subtypes. The Kruskal–Wallis test was used to compare the statistical difference between four ACRG molecular subtypes (p < 0.0001). (E) Correlations between HIscore and the known gene signatures in ACRG cohort using Pearson's analysis. Negative correlation was marked with blue and positive correlation with red. (F) Difference in the expression of 21 known biological processes related to tumor progression between high and low HIscore groups. The upper and lower ends of the boxes represented interquartile range of values. The lines in the boxes represented median value, and black dots showed outliers. The asterisks represented the statistical p value (*P < 0.05; **P < 0.01; ***P < 0.001; ****P < 0.0001).
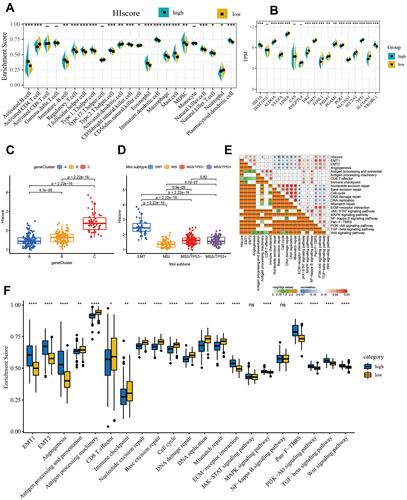
Figure 5 The close relationship between HIscore and TMB, microsatellite status, genomic instability. (A) Correlation between the TMB and HIscore in the TCGA cohort. (Pearson correlation analysis, R=−0.46, P < 0.0001) (B) Difference in the HIscore of patients between high and low TMB group. (C) Difference in the expression of 13 members of the hypoxia-immune signature between high and low TMB group. (D) The proportion of MSS, MSI-L and MSI-H patients in the high and low HIscore groups. (E) Difference in the HIscore of patients among MSS, MSI-L and MSI-H groups. (F) Difference in the expression of 13 members of the hypoxia-immune signature among MSS, MSI-L and MSI-H groups. (G) The proportion of genome unstable and genome stable patients in the high and low HIscore groups. (GU: genome unstable patient; GS: genome stable patient) (H) Difference in the HIscore of patients between GU and GS group. (I) Difference in the expression of 13 members of the hypoxia-immune signature between GU and GS group. The Kruskal–Wallis test was used to compare the statistical difference (*p < 0.05, **p < 0.01, ***p < 0.001, ****p < 0.0001).
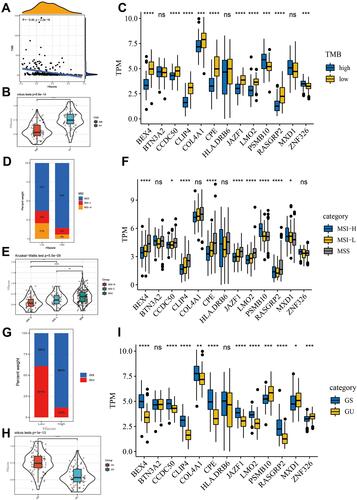
Table 2 Identification of Candidate Small-Molecule Drugs for Gastric Cancer Patients with High HIscore Using the CMAP Database