Figures & data
Figure 1 The mRNA expression of CLMN in BRCA. (A) CLMN expression overview in human cancer cell lines. Red box indicated BRCA. (B) Differential expression of CLMN in normal and breast cancer tissues. ***P<0.001.
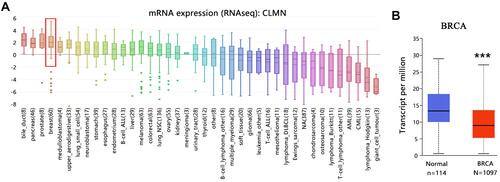
Figure 2 Protein expression of CLMN in BRCA. (A) CLMN protein expression overview in human cancers. Red box indicated BRCA. (B) The immunohistochemical images in normal and breast cancer tissues. (C) Protein expression comparison in BRCA and normal tissues. Z-values represented standard deviations from the median across samples. **P<0.01. (D) The protein location within cancer cells.
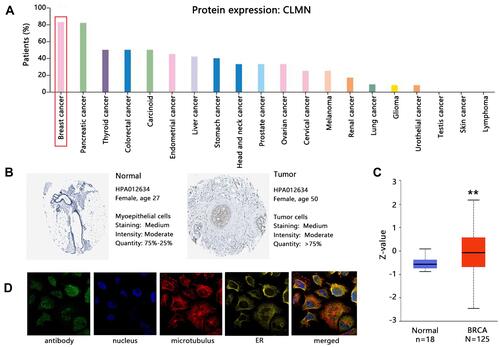
Figure 3 Related factors affecting CLMN mRNA expression involved in BRCA. (A) Correlation between CLMN expression and clinical data of patients. *P<0.05, **P<0.01 and ***P<0.001. (B) Correlation between CLMN expression and CNV. (C) CNV distribution of CLMN. (D) Differential expression of CLMN mRNA among CNV class.
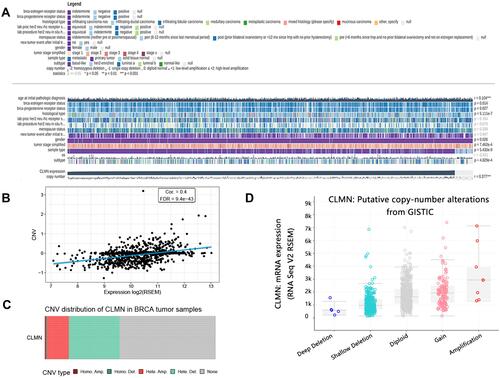
Figure 4 CLMN methylation analysis in BRCA. (A) Correlation between CLMN mRNA expression and methylation level. (B) Differential expression of CLMN methylation in normal and BRCA patients. ****P<0.0001. (C) Correlation between CLMN methylation level and overall survival of patients.
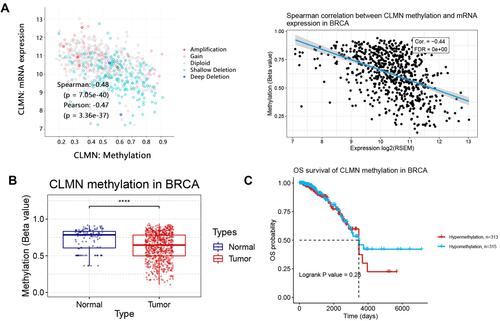
Figure 5 SNV summary and its correlation with survival in BRCA. (A) Somatic mutation of CLMN in BRCA. (B) Variant classification. (C) SNV class. (D) Impact of CLMN SNV on overall survival in BRCA.
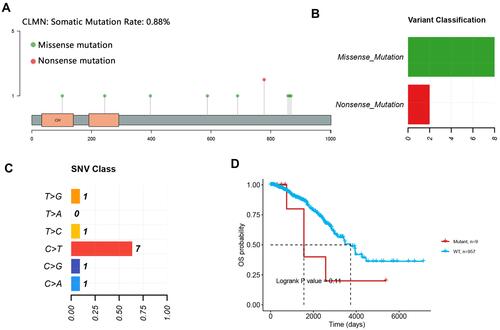
Table 1 10-Years Survival Difference Analysis Between CLMN Expression Groups (High vs Low)
Figure 6 The 10-year overall survival analysis on CLMN in BRCA. (A) Survival analysis on BRCA patients without restricted criteria. (B) Survival analysis on triple negative breast cancer patients. (C) Restrict overall survival analysis based on subtypes of BRCA.
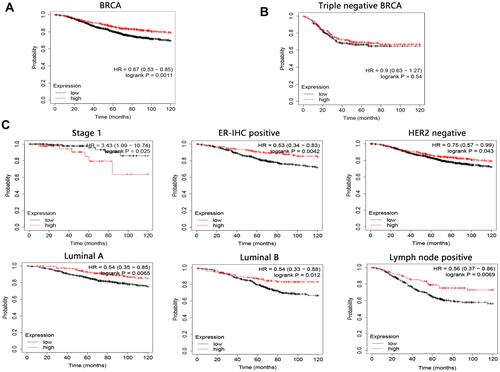
Figure 7 The co-expressed genes with CLMN in BRCA. (A) Volcano plot. (B) Heat map showing the top 50 genes with positive or negative correlation. (C) Association between CLMN and genes with highest positive or negative correlation coefficient.
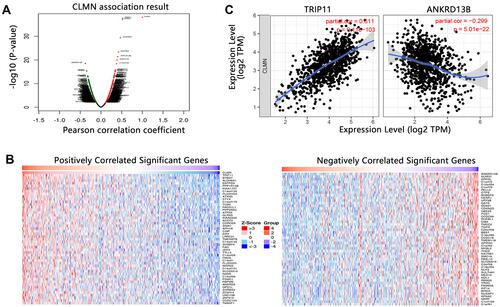
Figure 8 The GO annotation analysis associated with 50 positively co-expressed genes.
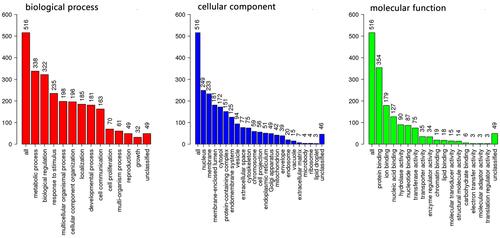
Figure 9 The biological pathway analysis on the top 50 co-expressed genes of CLMN with positive correlation. (A) Top 5 KEGG significant pathways. (B) Potential effect of CLMN on pathway activity in BRCA. The number in each cell indicated the percentage of cancers. Because we just focused on BRCA, therefore the number was presented as 100. (C) Activity of cell cycle and apoptosis pathways between high and low CLMN expression groups in BRCA.
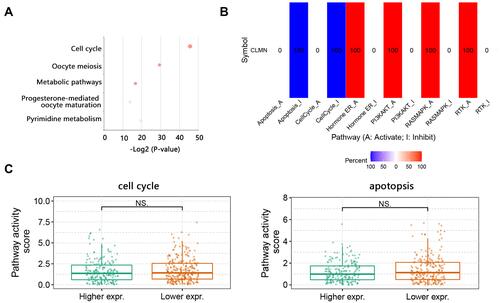
Figure 10 Gene set level analysis on 50 positively correlated significant genes of CLMN in BRCA. (A) GSEA score of gene set in BRCA. (B) Association between GSVA score and activity of cancer related pathways in BRCA. *P<0.05, #FDR<0.05. And Spearman correlation between GSVA score and (C) Cell cycle, (D) Hormone ER pathway activities in BRCA.
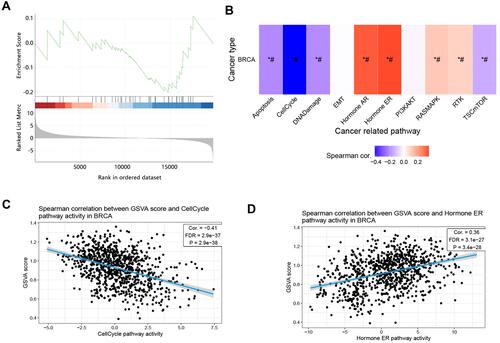
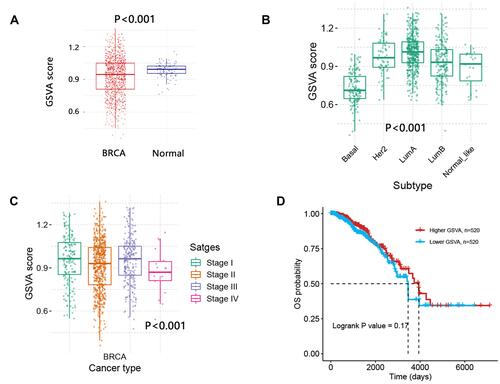
Figure 11 Comparison analysis of GSVA score in BRCA. (A) Differential GSVA in normal and BRCA patients. (B) GSVA score between subtypes. (C) GSVA score among stages. (D) Overall survival difference between GSVA score groups.