Figures & data
Figure 1 Flow chart of selecting eligible participants.
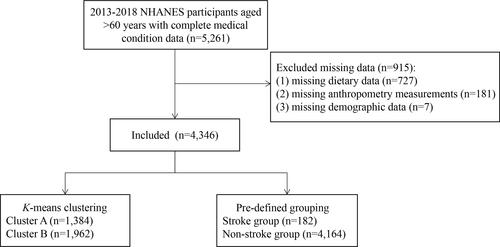
Table 1 Baseline Characteristics of the Overall Study Participants, NHANES 2013–2018 (n=4346)
Figure 2 K-means clustering: centroids of each cluster.
Abbreviations: PIR, poverty income ratio; HDL, high-density lipoprotein; TG, triglycerides; LDL, low-density lipoproteins; TC, total cholesterol; GHb, glycohemoglobin; GLU, plasma fasting glucose; CHF, congestive heart failure; CHD, coronary heart disease; HA, heart attack; PUFA, polyunsaturated fatty acids; BMI, body mass index.
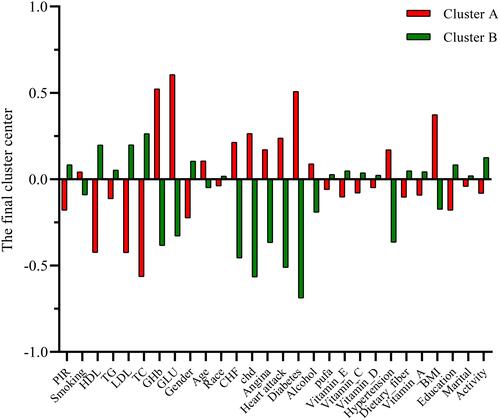
Figure 3 K-means clustering: the risk of stroke of each cluster.
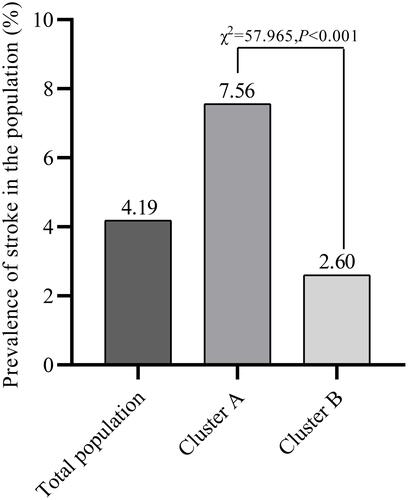
Table 2 Baseline Characteristics According to the Risk of Stroke, k-Means Clustering Method
Table 3 Baseline Characteristics According to the Risk of Stroke, Pre-Defined Grouping Method
Table 4 Logistic Regression Analysis of Stroke Risk Factors, Comparing the k-Means Clustering Method and the Pre-Defined Grouping Method
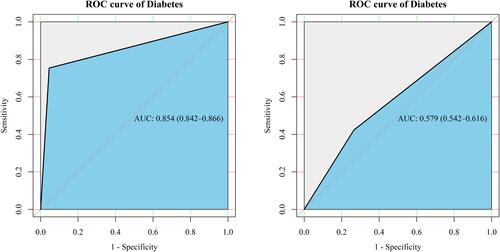
Figure 4 ROC curves evaluating the classification of diabetes.
Abbreviations: ROC, Receiver Operator Characteristic; AUC, area under curve.