Figures & data
Table 1 Baseline Characteristics
Figure 1 The flow chart of the included population.
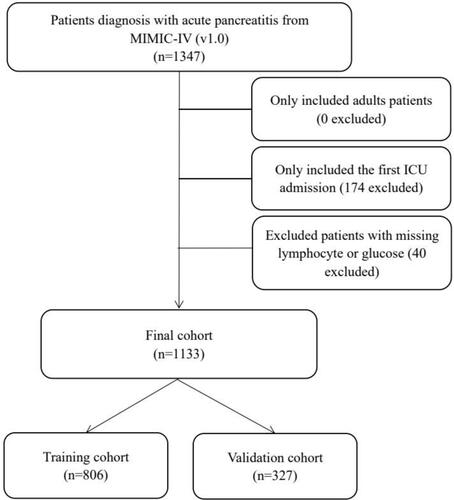
Table 2 Receiver Operating Curve Anaysis
Table 3 The Predictive Role of GLR with Glucose or Lymphocyte in Predicting In-Hospital Mortality
Table 4 Univariate and Multivariate Cox Regression Analyses of Factors Associated with In-Hospital Mortality in Training Cohort
Figure 2 Kaplan-Meier curves of critically ill patients with AP stratified by the optimal cut-off value of GLR in the (A) training cohort and (B) validation cohort.
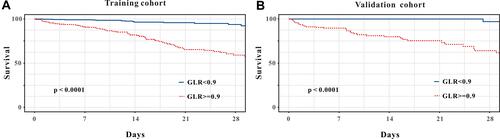
Figure 3 The survival nomogram for predicting in-hospital mortality of critically ill patients with AP. When using it, drawing a vertical line from each variables upward to the points and then recording the corresponding points (ie, “age ≥ 60 years old” = 3 points). The point of each variable was then summed up to obtain a total score that corresponds to a predicted probability of in-hospital mortality at the bottom of the nomogram.
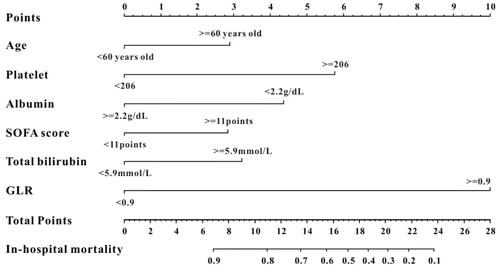
Figure 4 (A) The calibration curve for predicting in-hospital mortality in the training cohort. (B) The calibration curve for predicting in-hospital mortality in the validation cohort. (C) Decision curve analysis DCA of the nomogram to predict in-hospital mortality in the training cohort. (D) DCA of the nomogram to predict in-hospital mortality in the validation cohort.
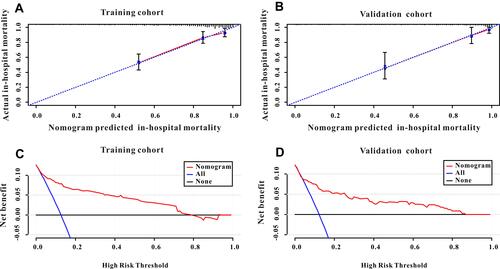
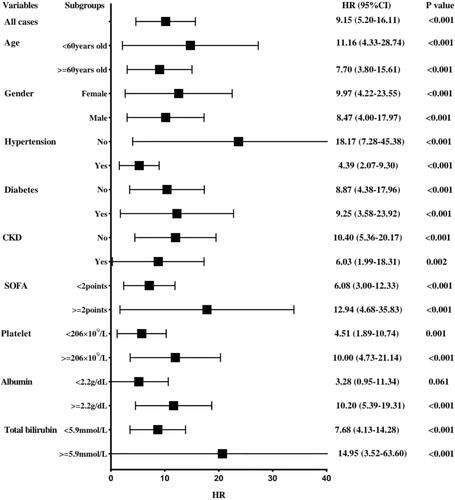
Figure 5 Hazard ratios (HRs) of prognostic marker GLR for overall survival in different patient subgroups in the training cohort.