Figures & data
Figure 1 The analysis of difference in transcriptional level of TMED2 in different types of cancers tissue paired with normal controls. (A) Transcriptional level analysis of TMED2 across cancerous samples paired with normal controls, and (B) Transcriptional level analysis of TMED2 across cancerous samples only. Blue color represents the normal samples while red color indicates the cancer samples. *p < 0.05.
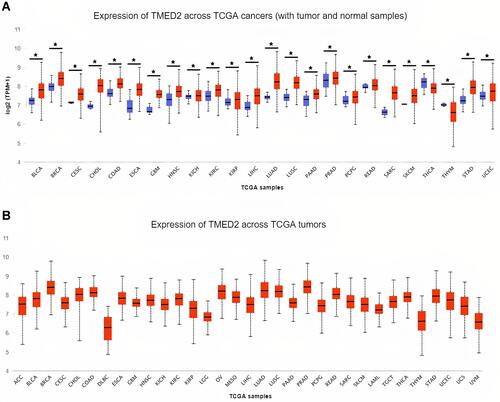
Figure 2 Correlational analysis of TMED2 dysregulation with OS and RFS in distinct cancer subtypes. (A) Correlational analysis of TMED2 dysregulation with OS in distinct cancer subtypes, and (B) Correlational analysis of TMED2 dysregulation with RFS in distinct cancer subtypes. A p-value < 0.05 was considered as significant.
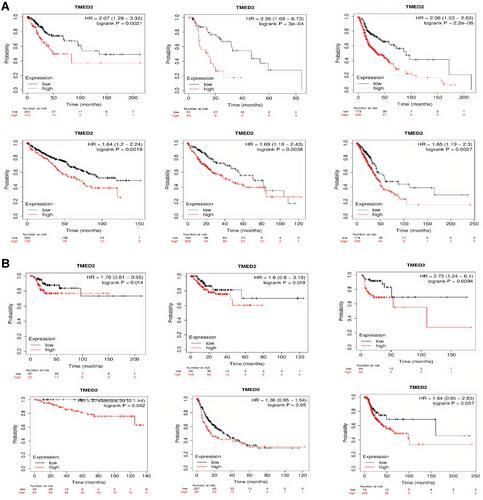
Table 1 Clinicopathalogical Features-Specific Expression Pattern of TMED2 in CESC, ESCA, HNSC, KIRC, LIHC, and LUAD Patients
Table 2 Clinicopathological Features of the CESC and ESCA Cohorts Included in the Present Study
Table 3 Clinicopathological Features of the HNSC and KIRC Cohorts Included in the Present Study
Table 4 Clinicopathological Features of the LIHC and LUAD Cohorts Included in the Present Study
Table 5 Details of the CESC, ESCA, HNSC, KIRC, LIHC, and LUAD Datasets Used for the TMED2 Expression Validation via GENT2 Web Server
Figure 3 Transcription expression level validation of TMED2 using independent CESC, ESCA, HNSC, KIRC, LIHC, and LUAD cohorts via GENT2 database. Blue color represents the normal samples while red color indicates the cancer samples. *p < 0.05.
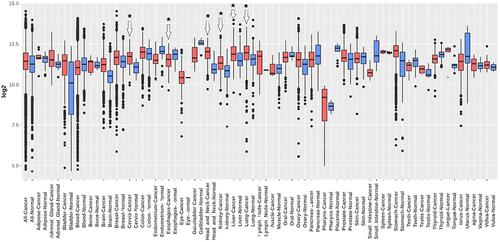
Figure 4 TMED2 translational expression analysis across distinct cancer tissues paired with normal controls via Human Protein Atlas (HPA) database (×200). (A) Cervical cancer, (B) Esophageal cancer, (C) Head and neck cancer, (D) Kidney cancer, (E) Liver cancer, and (F) Lung cancer.
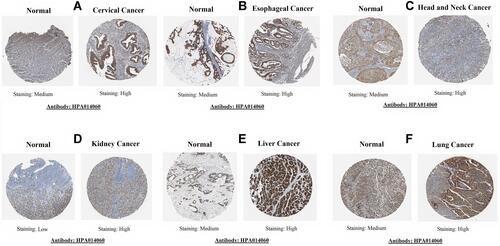
Figure 5 A MRXPRESS based correlation analysis between TMED2 expression and its promoter methylation in CESC, ESCA, HNSC, and KIRC. (A) In CESC, (B) In ESCA, (C) In HNSC, and (D) In KIRC. A negative sign indicates the negative correlation between TMED2 expression and its promoter methylation using a specific probe at a specific CpG island while a positive sign indicates the positive correlation between TMED2 expression and its promoter methylation using a specific probe at a specific CpG island. *p < 0.05.
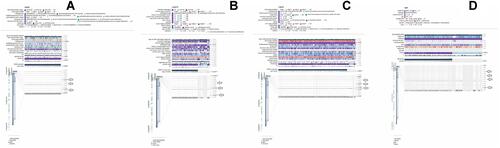
Figure 6 A MRXPRESS based correlation analysis between TMED2 expression and its promoter methylation in LIHC, and LUAD. (A) In LIHC, and (B) In LUAD. A negative sign indicates the negative correlation between TMED2 expression and its promoter methylation using a specific probe at a specific CpG island while a positive sign indicates the positive correlation between TMED2 expression and its promoter methylation using a specific probe at a specific CpG island. *p < 0.05.
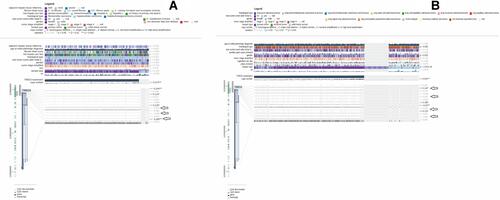
Figure 7 TMED2-related genetic alterations and CNVs in TCGA CESC, ESCA, HNSC, KIRC, LIHC, and LUAD datasets. (A) In CESC dataset, (B) In ESCA dataset, (C) In HNSC dataset, (D) In KIRC dataset, (E) In LIHC dataset and, (F) In LUAD dataset.
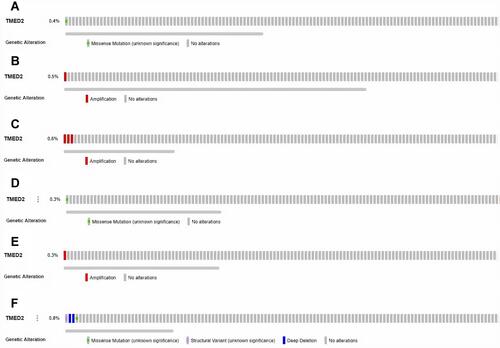
Table 6 Detail of Kyoto Encyclopedia of Genes and Genomes Pathway Analysis of the TMED2 Enriched Genes
Figure 8 A TMED2-enriched genes PPI network and pathway analysis. (A) A PPI network of TMED2 enriched genes, (B) Pathways analysis of the TMED2 enriched genes.
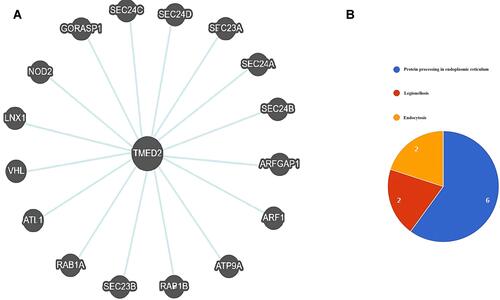
Figure 9 Spearman correlational analysis of TMED2 expression with CD8+ T immune cells level in CESC, ESCA, HNSC, KIRC, LIHC, and LUAD via TIMER. A p-value < 0.05 was considered as significant.
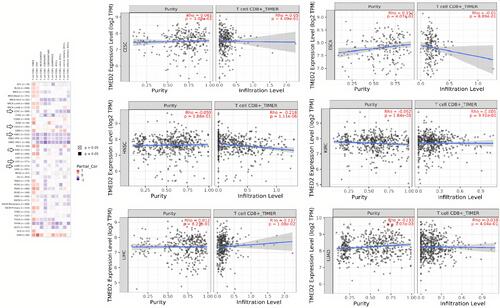
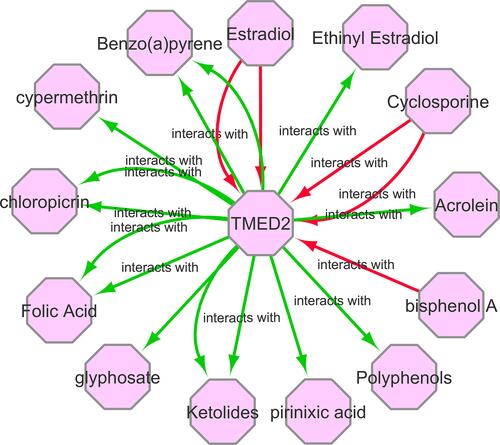
Figure 10 A gene–drug interaction network of TMED2 targeted drugs from CTD. Red arrows show chemotherapeutic drugs that can increase TMED2 expression while green arrows highlight chemotherapeutic drugs that can decrease TMED2 expression. The numbers of arrows between each interaction represent the supported numbers of studies.