Figures & data
Figure 1 The flowchart of this study.
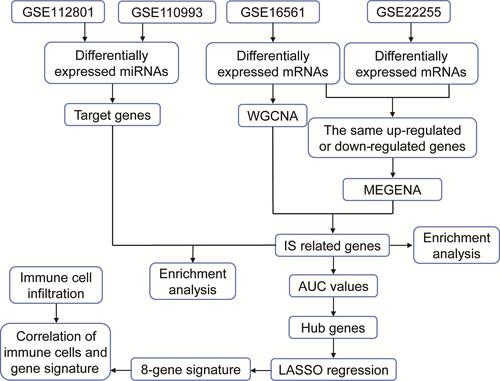
Figure 2 The co-expression network constructed by WGCNA. (A) Genes differentially expressed between IS patients and controls were identified by limma R package in GSE16561. Red dots represent genes upregulated in IS; blue, genes downregulated in IS. (B) Scale-free fit index analysis and average connectivity analysis for selection of soft-threshold β. (C) Clustering tree of co-expression module genes. (D) Heatmap of WGCNA network.
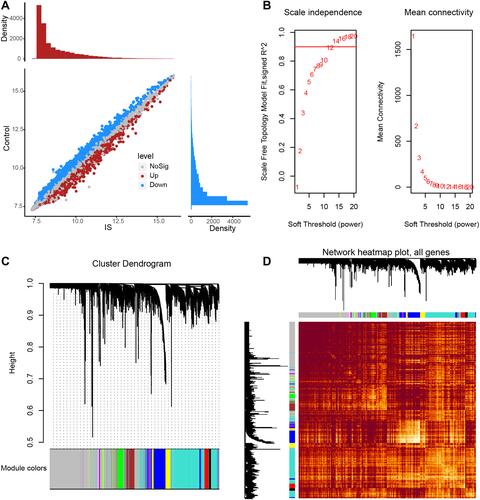
Figure 3 Co-expression modules of IS-associated genes, constructed by MEGENA. (A) Genes differentially expressed between ischemic stroke (IS) patients and controls were identified by limma R package in the GSE22255 dataset. Red dots represent genes upregulated in IS; blue, genes downregulated in IS. (B) Up- and downregulated DEmRs common to the two network analyses. (C) The global MEGENA network of common genes. Each node represents one module. The larger the node, the greater the number of module genes were included. (D) Child modules with the largest number of module genes in the MEGENA network. Each color represents one child module. Triangles represent hub genes of modules.
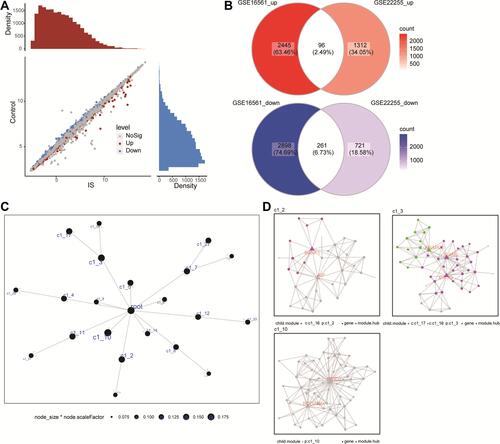
Figure 4 Analysis of biological processes and KEGG pathways enriched in genes related to IS. (A) The main 10 functional terms of biological process (BP) enrichment analysis. Orange columns are activated terms and blue columns are inhibited terms in IS relative to controls. (B) The main 10 signaling pathways of Kyoto Encyclopedia of Genes and Genomes (KEGG) enrichment analysis. Orange columns are activated terms and blue columns are inhibited terms in IS relative to controls. (C) Significantly activated or inhibited KEGG pathways in IS, based on GSEA.
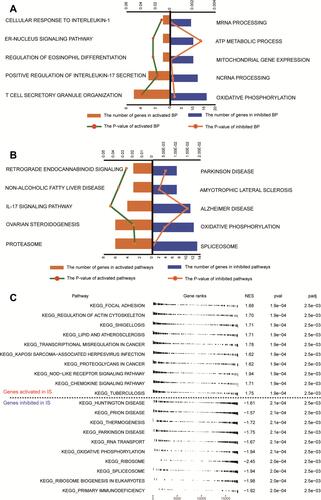
Figure 5 Regulatory network of miRNAs for IS-associated mRNAs. (A) Differentially expressed miRNAs between IS patients and controls in the GSE112801 dataset. Red dots represent miRNAs upregulated in IS; blue, miRNAs downregulated in IS. (B) Up- and downregulated DEmiRs common to both the GSE112801 and GSE110993 datasets. (C) Sankey map of miRNA-regulated mRNAs involved in KEGG signaling pathways.
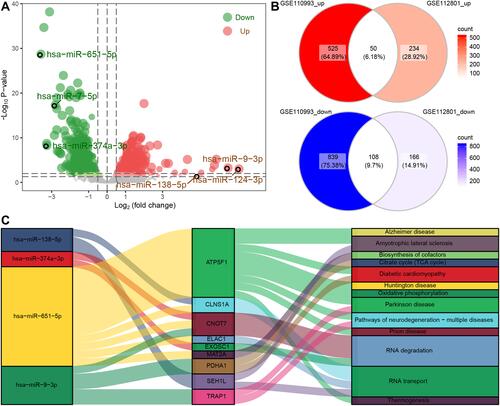
Figure 6 Potential candidate genes for IS. (A) Areas under the receiver operating characteristic curve (AUCs) for dysregulated genes in the GSE16561 and GSE22255 datasets. (B) Mean AUCs of hub genes. Red represents genes upregulated in IS; blue, genes downregulated in IS. (C) Distribution of LASSO coefficients for the 8-gene signature. (D–F) Receiver operating characteristic curves for the gene signature in the (D) training set of GSE16561, (E) validation set of GSE16561 and (F) GSE22255.
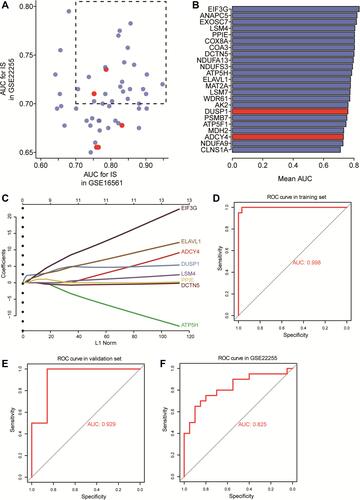
Figure 7 Expression of signature genes in IS patients and controls. (A) The expression of signature genes in IS patients and controls in the GSE16561 dataset. ***P<0.001. (B) Expression of signature genes in IS patients and controls in the GSE22255 dataset. (C) Heatmap of signature genes in IS patients and controls in the GSE16561 and GSE22255 datasets. Black type represents upregulation; blue type, downregulation.
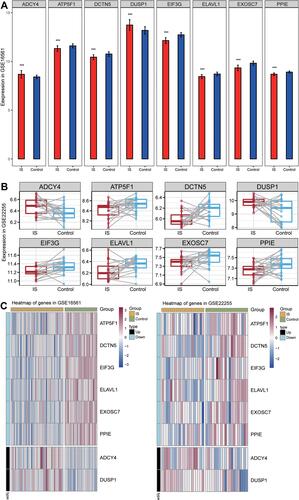
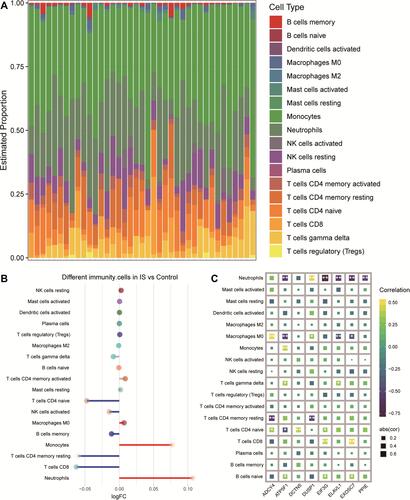
Figure 8 Differences between IS patients and controls in brain tissue infiltration by immune cell types. (A) Bar plot of levels of infiltration by 18 types of immune cells in the brains of IS patients. (B) Differences in immune cell infiltration between IS patients and controls. Red indicates significantly greater infiltration in IS; blue, significantly less infiltration. (C) Correlations between immune cell infiltration and expression of signature genes in IS. *P < 0.05, **P < 0.01.