267
Views
8
CrossRef citations to date
0
Altmetric
Original Research

The Clinical Diagnostic Values of SAA, PCT, CRP, and IL-6 in Children with Bacterial, Viral, or Co-Infections

, , , , &
Pages 7107-7113 | Published online: 24 Oct 2021

Figures & data

Table 1 Clinicopathologic Characteristics of the Patients and Healthy Controls

Table 2 Infection Symptoms of the Patients

Figure 1 Analysis for the levels of serum biochemical biomarkers in children with bacterial, viral, or co-infections. (A) The level of serum SAA in children with bacterial, viral, or co-infections. (B) The level of serum PCT in children with bacterial, viral, or co-infections. (C) The level of serum IL-6 in children with bacterial, viral, or co-infections. (D) The level of serum CRP in children with bacterial, viral, or co-infections.

Figure 1 Analysis for the levels of serum biochemical biomarkers in children with bacterial, viral, or co-infections. (A) The level of serum SAA in children with bacterial, viral, or co-infections. (B) The level of serum PCT in children with bacterial, viral, or co-infections. (C) The level of serum IL-6 in children with bacterial, viral, or co-infections. (D) The level of serum CRP in children with bacterial, viral, or co-infections.

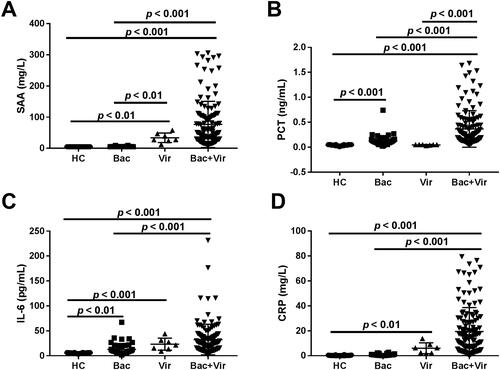
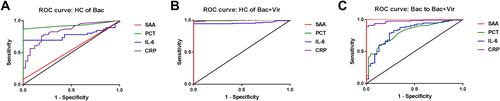
Table 3 Sensitivity and Specificity of SAA, PCT, CRP, and IL-6 in Different Groups

Figure 2 Diagnostic values of serum biochemical biomarkers in children with bacterial, viral, or co-infections. (A) ROC curves for SAA, PCT, IL-6, and CRP for discrimination between bacterial infection and healthy control. (B) ROC curves for SAA, PCT, IL-6, and CRP for discrimination between co-infection and healthy control. (C) ROC curves for SAA, PCT, IL-6, and CRP for discrimination between co-infection and bacterial infection.

Figure 2 Diagnostic values of serum biochemical biomarkers in children with bacterial, viral, or co-infections. (A) ROC curves for SAA, PCT, IL-6, and CRP for discrimination between bacterial infection and healthy control. (B) ROC curves for SAA, PCT, IL-6, and CRP for discrimination between co-infection and healthy control. (C) ROC curves for SAA, PCT, IL-6, and CRP for discrimination between co-infection and bacterial infection.