Figures & data
Figure 1 Modular clustering and its analysis correlation with clinical characteristics. (A) Module cluster tree diagram. (B) Cluster dendrogram. (C) Module–trait relationships.
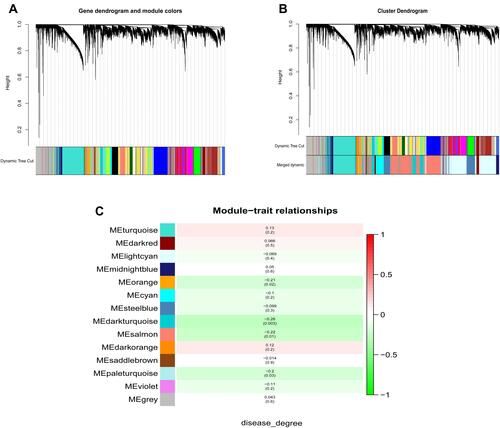
Figure 2 The bubble diagram of BP-related TOP10 term obtained by GO enrichment of HUB module gene.
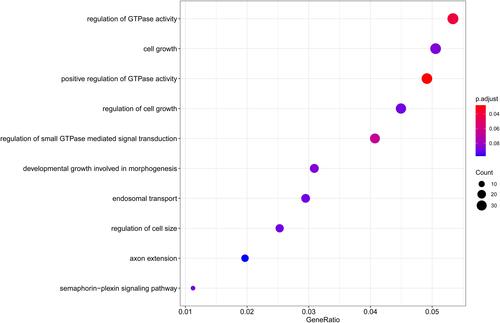
Figure 3 The protein interaction network of key genes.
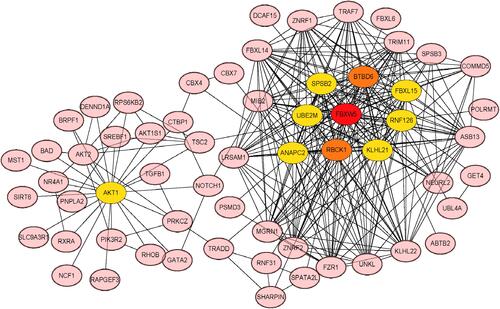
Figure 4 Screening of biomarkers.
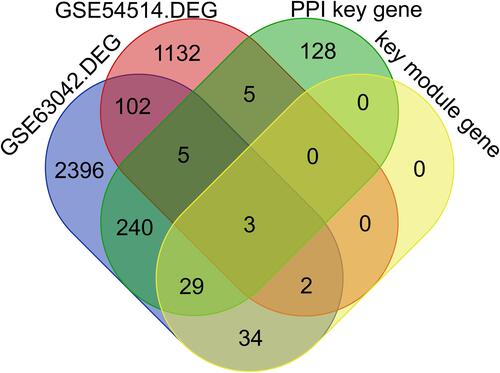
Figure 5 Analysis of the relationship between biomarkers and survival. (A) The significance of biomarkers on survival in the GSE54514 dataset. (B) Significant effect of biomarkers on survival in the GSE63042 dataset.
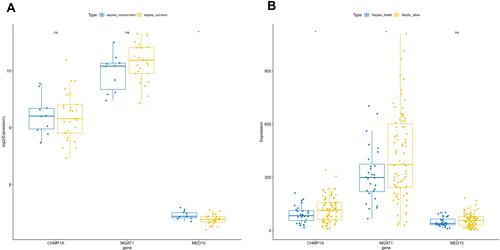
Figure 6 Single-gene GSEA enrichment analysis of biomarkers. (A) GO term bubble image: CHMP1A single gene GESA enrichment. (B) GO myeloid leukocyte mediated immunity (CHMP1A). (C) GO term bubble image: MED15 single gene GESA enrichment. (D) GO term bubble image: MGAT1 single gene GESA enrichment. (E) GO myeloid leukocyte mediated immunity (MGAT1).
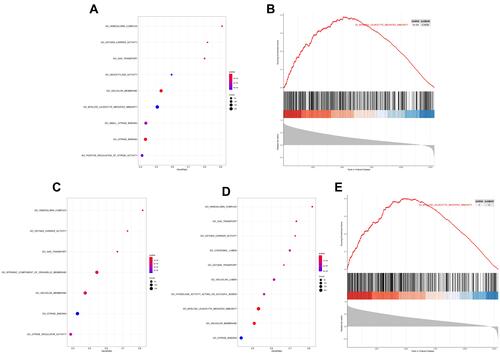
Figure 7 Immune cell infiltration in normal/living/dead individuals.*P<0.05, **P<0.01,***P<0.001.
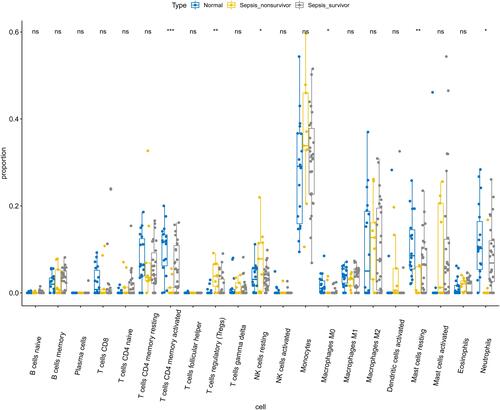
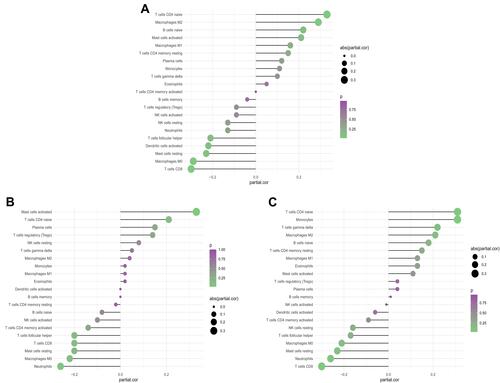
Figure 8 Correlation analysis between biomarkers and immune cells. (A) Correlation diagram of CHMP1A gene and immune cells. (B) Correlation diagram of MED15 gene and immune cells. (C) Correlation diagram of MGAT1 gene and immune cells.