Figures & data
Figure 1 Identification of a metabolism-related signature and gene functional enrichment analysis. (A) Volcano plot of DEMRGs: red indicates upregulated MRGs, green indicates downregulated MRGs, and black indicates MRGs that were not significantly differentially expressed. (B) Heatmap of MRGs in KIRC and normal kidney tissues in the TCGA database; Green to red represents the progression from low expression level to high expression level. (C) GO-term function enrichment analysis of MRGs. BP-biological process, CC-cellular component, MF-molecular function. (D) KEGG analysis of MRGs.
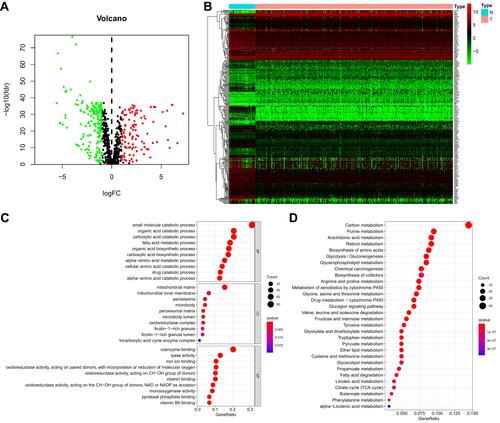
Figure 2 Establishment of metabolism-related prognostic signature. (A and B) Lasso Cox regression algorithm. (C) Forrest plot of the multivariate Cox regression analysis results (P < 0.05).
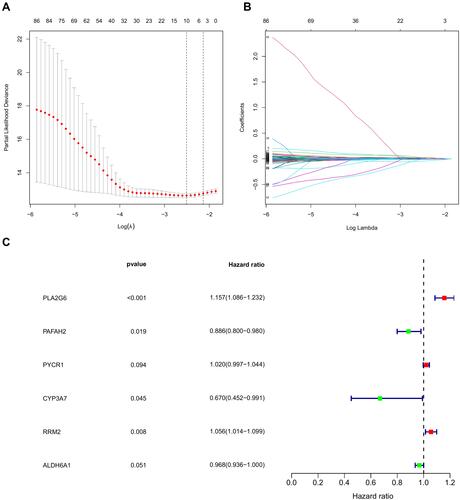
Figure 3 Development of metabolism-related prognostic signature of ccRCC patients in the TCGA database. (A) A nomogram based on the signature in ccRCC patients at 1, 3, and 5 years. (B–D) Calibration curves of the nomogram for the signature at 1, 3, and 5 years. (E) Heatmap of the metabolism-related gene expression in the TCGA database. (F) Risk plot showing each point based on the risk score. (G) Survival status of ccRCC patients. (H) Kaplan-Meier plot for overall survival (OS) based on risk score of the six MRGs-based signature of ccRCC patients in the TCGA database. (I) Time-independent ROC analysis of risk scores for OS prediction in the TCGA database.
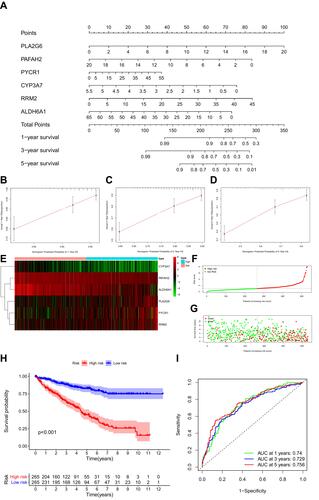
Figure 4 Kaplan-Meier plot for OS based on the risk score of the six MRGs-based signatures of ccRCC patients in the GEO database.
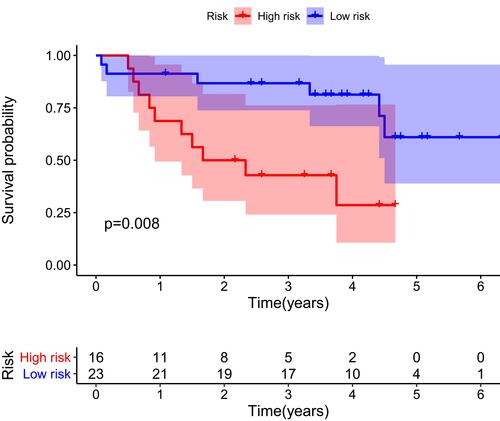
Figure 5 Univariate (A) and multivariate (B) independent prognostic analysis of independent risk factors for OS in patients with ccRCC.
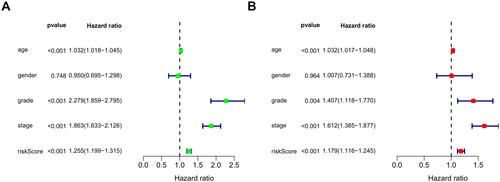
Figure 6 MRGs expression in the TCGA database (P < 0.05). (A) Expression level of PLA2G6, (B) PYCR1, (C) RRM2, (D) ALDH6A1, (E) CYP3A7, and (F) PAFAH2.
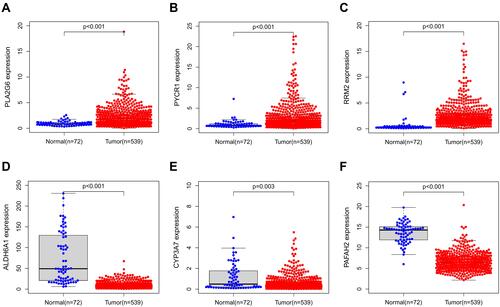
Figure 7 The relationship between MRGs expression and OS of ccRCC patients in the TCGA database (P < 0.05). (A) The relationship between ALDH6A1 and OS, (B) CYP3A7 and OS, (C) PAFAH2 and OS., (D) PYCR1 and OS, (E) PLA2G6 and OS, and (F) RRM2 and OS.
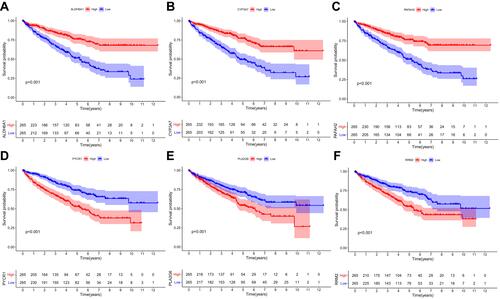
Figure 8 The immune infiltration in ccRCC. (A) Heatmap of the 22 immune cell proportions. (B) Violin plot visualizing the difference in immune infiltration between normal and tumor tissues. (C) Heatmap depicting correlations between infiltrated immune cells in tumor tissues.
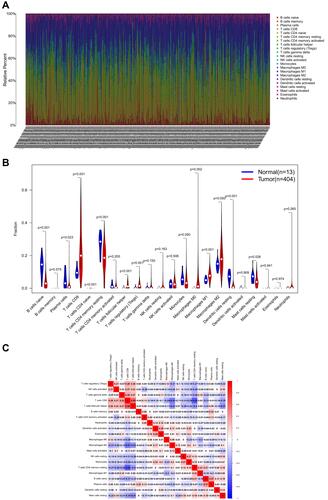
Figure 9 Survival plots of the median of immune cell subsets with P-value. (A–D) Key immune cells influencing patients’ survival based on the median level of immune cells.
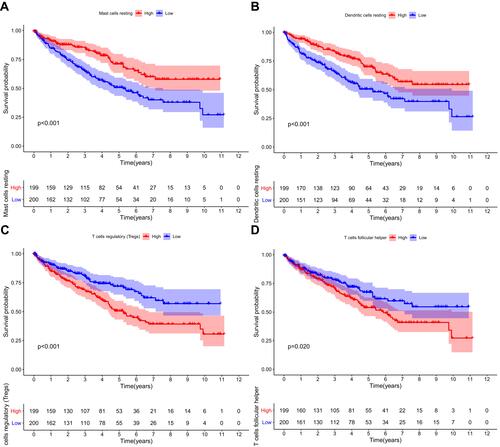
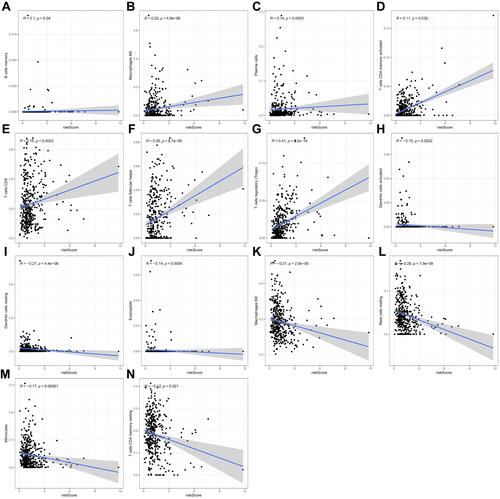
Figure 10 Scatter plot showing the relationship between infiltrated immune cells and prognostic model (P < 0.05). (A–G) Positive correlations between infiltrated immune cells and prognostic model. (H–N) Negative correlations between infiltrated immune cells and prognostic model.