
Figures & data
Table 1 Baseline Clinical Characteristics
Table 2 Angiographic Characteristics
Table 3 Procedural Characteristics
Table 4 Clinical Outcomes on 24-Month Follow-Up
Figure 1 Two-year MACE rates in patients who underwent CTO PCI. Patients who underwent ISR CTO PCI versus those who underwent de novo CTO PCI, Log-rank P<0.0001.
Abbreviations: MACE, major adverse cardiac events; CTO, chronic total occlusion; PCI, percutaneous coronary intervention; ISR, in-stent restenosis.
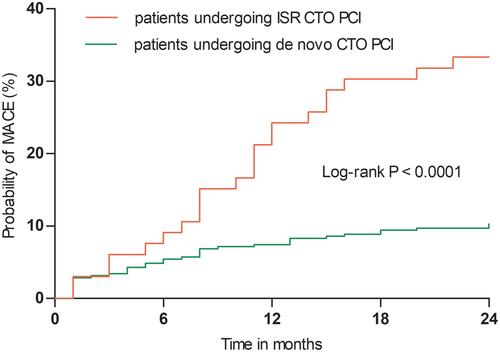
Figure 2 Two-year TVR rates in patients who underwent CTO PCI. Patients who underwent ISR CTO PCI versus those who underwent de novo CTO PCI, Log-rank P<0.0001.
Abbreviations: TVR, target vessel revascularization; CTO, chronic total occlusion; PCI, percutaneous coronary intervention; ISR, in-stent restenosis.
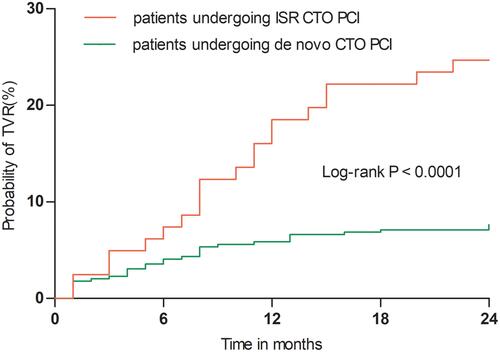
Table 5 Independent Predictors of MACEs in Patients Who Underwent CTO PCI