
Figures & data
Figure 1 Heat map showing the relative mRNA expression levels of the sphingolipid metabolism-related genes in female IDC tissues and NST obtained from TCGA BRCA cohort. In the data shown in matrix format, each row represents an individual gene and each column represents a single tissue. Each cell in the matrix represents the relative mRNA expression level of a gene feature in an individual tissue. The red and green in the cells reflects relatively high and low expression levels, respectively, as indicated by the scale bar. The samples are sorted into the NST group on the left and the IDC group on the right. Each cells is arranged in descending order of the mean difference between the scaled mRNA expression levels of each gene in the NST and IDC groups.
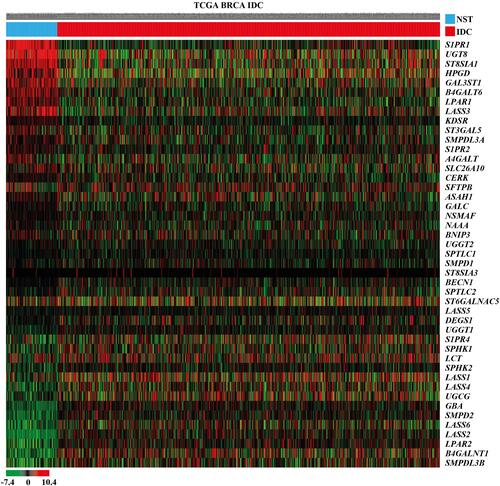
Figure 2 (A) Heat map showing significantly altered mRNA expression of the sphingolipid metabolism‑related genes in female IDC tissues compared with female NST obtained from TCGA BRCA cohort. In the data shown in matrix format, each row represents an individual gene and each column represents a single tissue. Each cell in the matrix represents the relative mRNA expression level of a gene feature in an individual tissue. The red and green in the cells represent relatively high and low expression levels, respectively, as indicated by the scale bar. The samples are sorted into the NST group on the left and the IDC group on the right. Each cells is arranged in descending order of the mean difference between the scaled mRNA expression levels of each gene in the NST and IDC groups. *Student’s t-test, P<0.05 (NST versus IDC). (B) Relatively altered mRNA expression levels of various sphingolipid metabolism-related genes in IDC samples obtained from TCGA BRCA. **Student’s t-test, P<0.001, |2FC| ≥ 1.0.
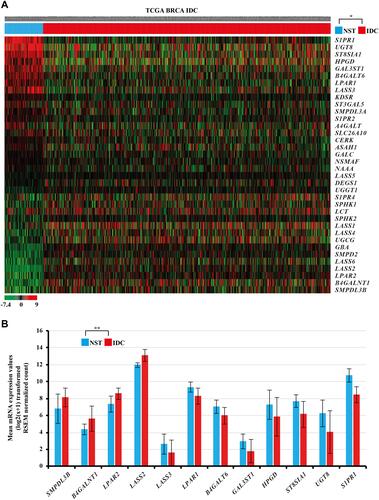
Figure 3 Survival analysis of the dysregulated sphingolipid metabolism-related genes in IDC samples obtained from TCGA BRCA cohort. Kaplan–Meier estimates of female patients with IDC according to the relative mRNA expression values of GAL3ST1, SMPDL3B, LASS3, LASS2, B4GALT6, HPGD, UGT8, ST8SIA1, S1PR1, LPAR1, B4GALNT1, and LPAR2.
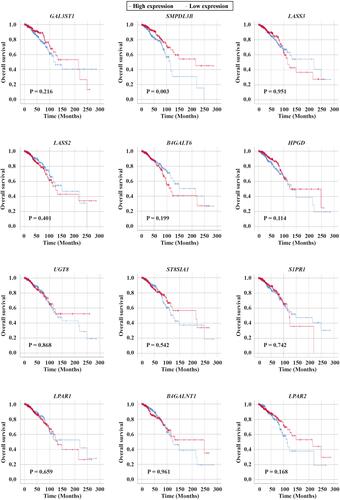
Table 1 Upregulated mRNA Expression Levels of Sphingolipid Metabolism-Related Genes in Relation to Clinicopathological Parameters of IDC
Table 2 Downregulated mRNA Expression Levels of Sphingolipid Metabolism-Related Genes in Relation to Clinicopathological Parameters of IDC
Table 3 Spearman Correlation Analysis Between Inter-Individual Components of Sphingolipid Metabolism-Related Genes