Figures & data
Table 1 Summary of Clinical Characteristics and Adjuvant Examination Items in Patients with Osteosarcoma
Figure 1 Clinical characteristics and ancillary examination results of 90 patients with osteosarcoma. Patients were randomly divided into the training cohort (n=45) and validation cohort (n=45). Each line in the heat map represents a patient. Values for age and tumor volume were standardized.
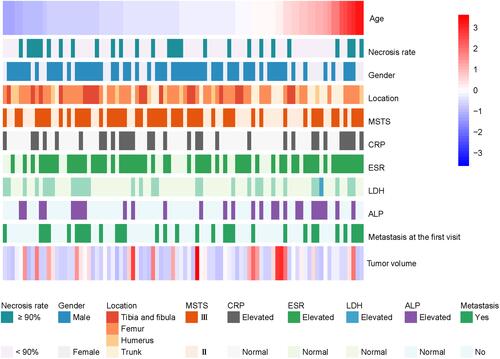
Figure 2 The nomogram to predict the efficacy of chemotherapy for osteosarcoma. The first line is the point range for the variables. The second to 11th lines are the ten clinical characteristics and ancillary examination items included in the study. The last one represents the probability value of a high necrosis rate (≥90%).
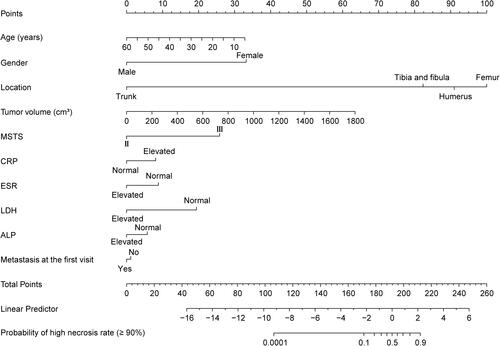
Table 2 The Validation of Chemotherapy Efficacy Prediction Nomogram
Figure 3 Evaluation of the accuracy of the chemotherapy efficacy prediction nomogram. (A) ROC is used to evaluate the predictive power of the chemotherapy efficacy prediction nomogram. The AUC in the training cohort is 0.793 (95% CI: 0.632, 0.954). (B) The AUC in the validation cohort is 0.791 (95% CI: 0.644, 0.938). (C) ROC results of the training cohort and the validation cohort were compared.
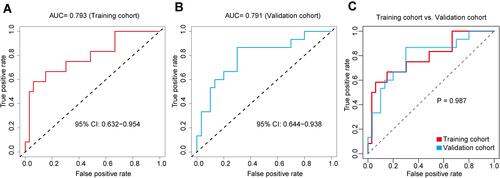
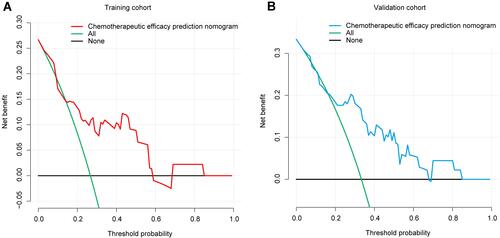
Figure 4 Decision curve analysis for the chemotherapy efficacy prediction nomogram. (A) The red line represents the chemotherapy efficacy prediction nomogram of the training cohort. When the threshold probability is between 1% and 58%, the nomogram has a relatively good net benefit. (B) The blue line represents the chemotherapy efficacy prediction nomogram of the validation cohort. When the threshold probability is between 4% and 67%, the nomogram has a relatively good net benefit.