Figures & data
Figure 1 Flow chart of the present study. PCA, principal component analysis.
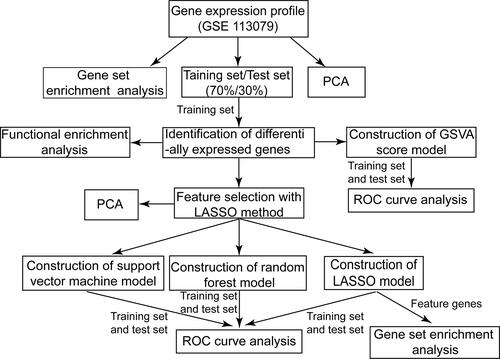
Figure 2 Differential gene expression analysis and functional enrichment analysis. (A) Volcano map. Red indicates genes that were up-regulated in coronary artery disease (CAD) patients compared to healthy samples, green indicates genes that were down-regulated, and gray indicates genes with similar expression between both groups. (B) Heat map of differentially expressed genes (DEGs). The depth of color reflects the level of differential expression. (C) The biological processes where DEGs may be involved according to enrichment analysis. (D) Kyoto Encyclopedia of Genes and Genomes (KEGG) pathways in which DEGs may be involved. (E) Biological processes where DEGs may be involved according to Clue GO analysis. (F) KEGG pathways enriched in CAD samples.
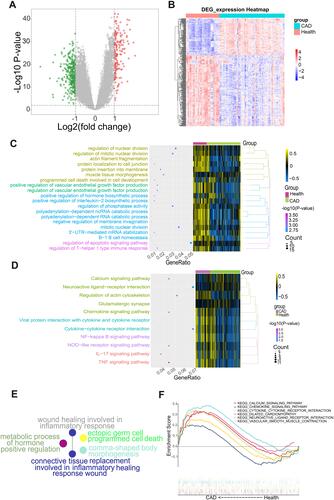
Table 1 The 20 Feature Genes Selected by Least Absolute Shrinkage and Selection Operator (LASSO) Method
Figure 3 Least absolute shrinkage and selection operator (LASSO) model and principal component analysis (PCA). (A) Ten-times cross-validation of parameter selection in the LASSO model. (B) PCA after LASSO variable reduction. (C) Receiver operating characteristic (ROC) curve of the training set. (D) ROC of the test set.
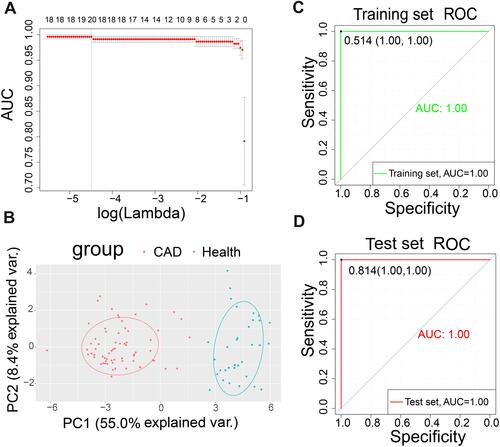
Figure 4 Support vector machine (SVM) model. (A) Receiver operating characteristic (ROC) curve of the training set. (B) ROC of the test set.
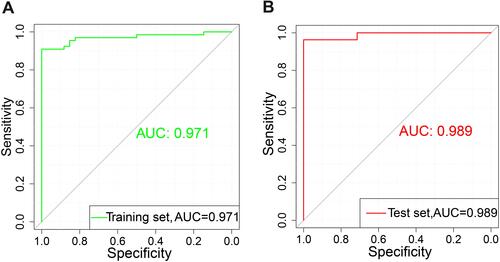
Figure 5 Evolution of the Z-score during Boruta operation. (A) The Boruta function was used to further select features in the 20 differentially expressed genes. (B) Receiver operating characteristic (ROC) curve of the training set. (C) ROC of the test set.
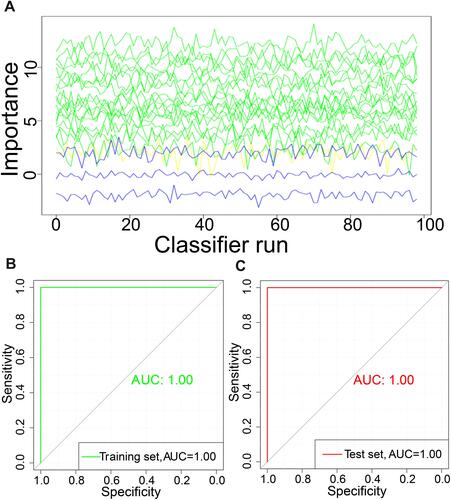
Figure 6 Gene set variation analysis (GSVA) score model. (A) Receiver operating characteristic (ROC) curve of the training set. (B) ROC of the test set.
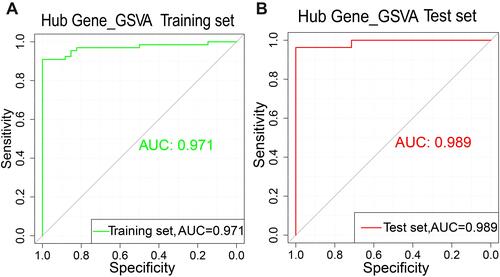
Table 2 Performance of the Four Classifiers for Diagnosing CAD
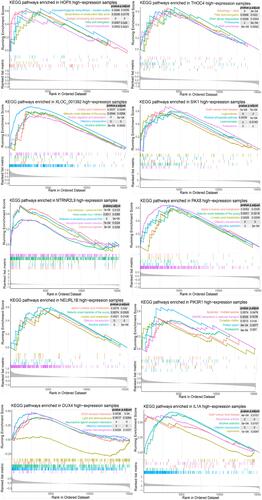
Figure 7 Gene set expression analysis (GSEA) of optimal genes and Kyoto Encyclopedia of Genes and Genomes (KEGG) pathways enriched in the 10 differentially expressed genes.
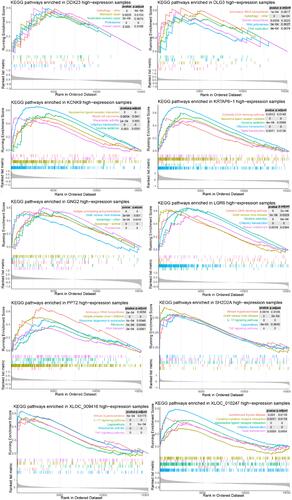
Figure 8 Gene set expression analysis (GSEA) of optimal genes and Kyoto Encyclopedia of Genes and Genomes (KEGG) pathways enriched in the 10 differentially expressed genes.