Figures & data
Figure 1 The expression of THBS1 in gastric cancer. (A) THBS1 in different cancers increased or decreased compared with normal tissues in the Oncomine database. (B) The expression of THBS1 in different tumor types by TIMER database. (C) The expression of THBS1 in GC tissues compared with normal tissues in TCGA. (D–E) The expression of THBS1 in GC tissues compared with normal tissues in GSE66229 and GSE118916. (F)The protein expression of THBS1 in GC tissues compared with adjacent normal tissues. * P<0.05, **P<0.01, ***P<0.001, ****P<0.0001.
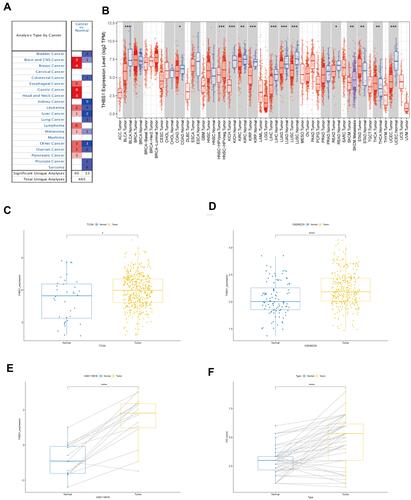
Figure 2 IHC staining of THBS1 (magnification, x200). (A) High expression of THBS1 in GC tissues. (B) Low expression of THBS1 in GC tissues. (C) High expression of THBS1 in adjacent normal tissues. (D) Low expression of THBS1 in adjacent normal tissues.
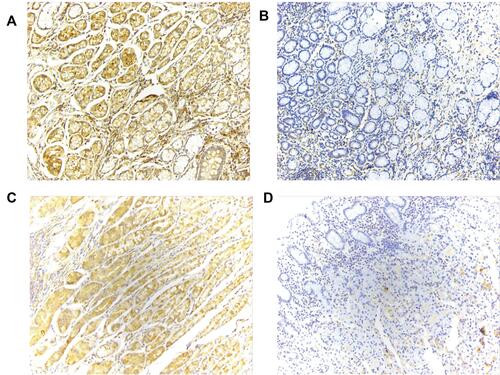
Table 1 Univariate and Multivariate Cox Regression Analysis of OS in Gastric Cancer Patients (n=325)
Figure 3 Correlation analysis between THBS1 expression and prognostic survival in STAD patients. (A) Differential expression of THBS1 in different pathological stage. (B) Kaplan-Meier OS curves of survival differences among TCGA-STAD cohort. (C) Kaplan-Meier OS curves of survival differences among GSE62254 dataset. (D) Kaplan-Meier DFS curves of survival differences among GSE62254 dataset.
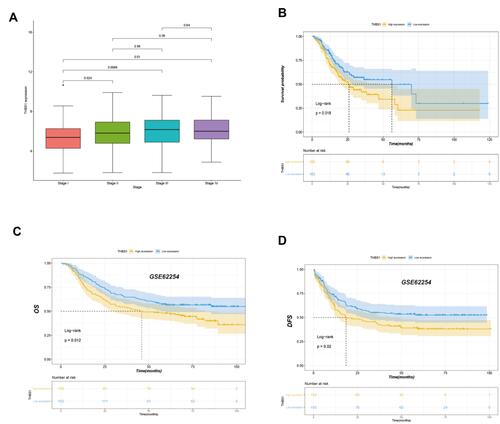
Figure 4 GSEA analysis of THBS1 expression in GC. The top 20 GSEA results of Reactome pathways (A) and KEGG pathways (B).
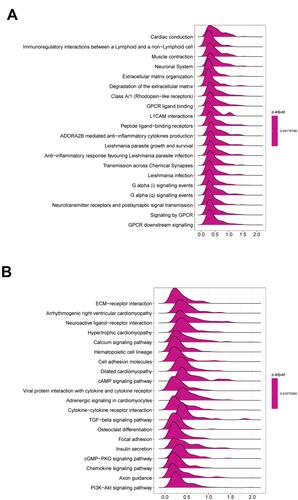
Figure 5 Relationship between THBS1 and immune and stromal scores in GC. (A) High THBS1 expression was associated with high stromal score in GC. (B) High THBS1 expression was associated with high immune score in GC. (C) High THBS1 expression was associated with high immune and stromal scores in GC. (D) High immune score and stromal score are negatively associated with prognosis of GC. ****P<0.0001.
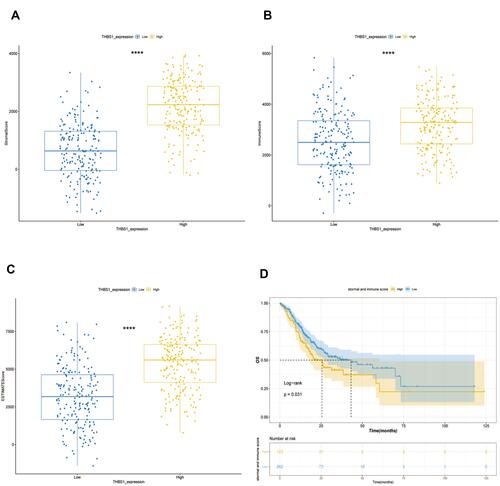
Figure 6 Correlation of THBS1 with TME in GC. (A) Cell types and distribution of STAD_GSE134520. (B) Expression and distribution of THBS1 in each cell. (C) Correlation of THBS1 expression with TME.
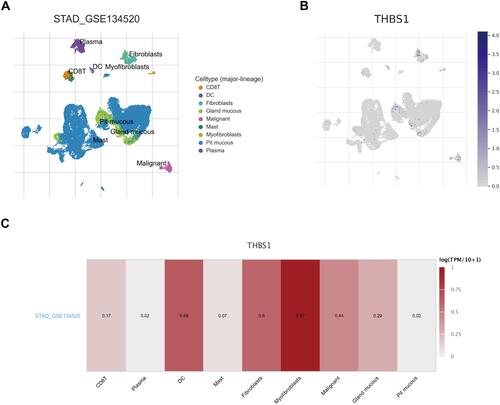
Figure 7 Relationship between THBS1 and immune infiltration. (A) THBS1 expression relates to immune cell infiltration levels in STAD. (B) Relationship between high and low expression of THBS1 in 22 types of tumor-infiltrating immune cells, the blue violin diagram presented low THBS1 expression group, and the red violin diagram presented high THBS1 expression group.
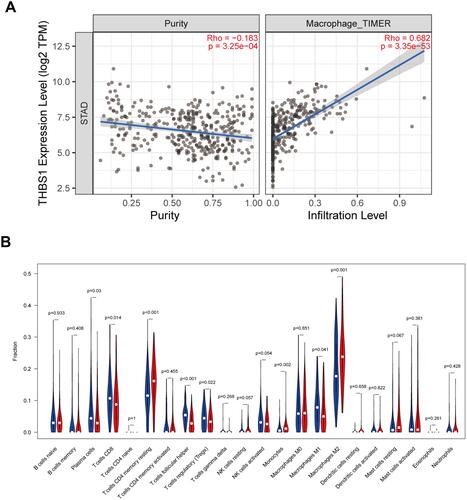
Figure 8 Correlation of THBS1 expression with CAFs. Red represents positive correlation and blue represents negative correlation. THBS1 expression is significantly positively correlated with CAFs in pan-cancer.
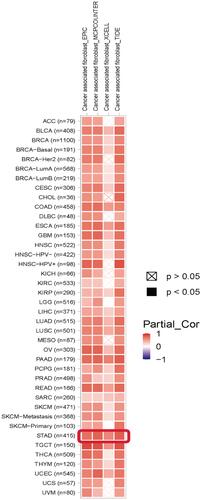
Figure 9 Correlation of THBS1 with immune checkpoint members. (A) THBS1 expression is correlated with immunoinhibitors in pan-cancer, red represents positive correlation, blue represents negative correlation, the deeper the color, the stronger the correlation. (B) THBS1 expression is correlated with immune checkpoint members in TCGA-STAD, red represents positive correlation, green represents negative correlation.
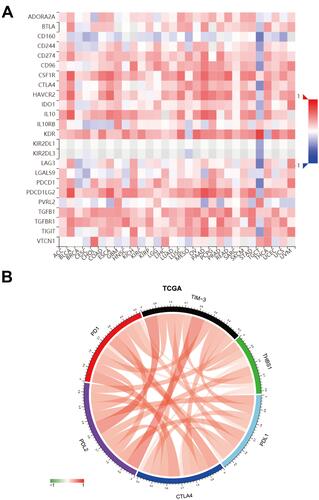
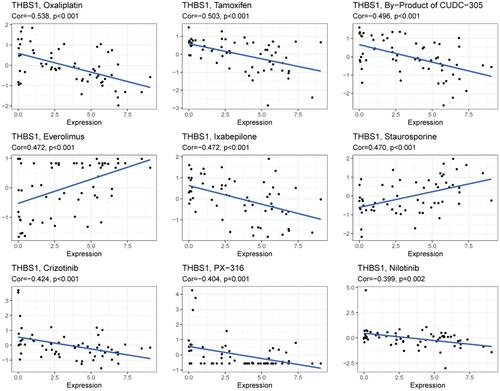
Figure 10 Correlation of THBS1 expression with the sensitivity of anticancer drugs.