Figures & data
Table 1 Top 10 Up- and Down-Regulated DEmRNAs
Figure 1 The heatmap of the DEmRNAs in AMI (A) and MF after AMI (B), DEmiRNAs in AMI (C) and MF after AMI (D), and DElncRNAs in AMI (E) and MF after AMI (F). Row and column represented DEmRNAs/DEmiRNAs/DElncRNAs and samples, respectively. The color scale represented the expression levels.
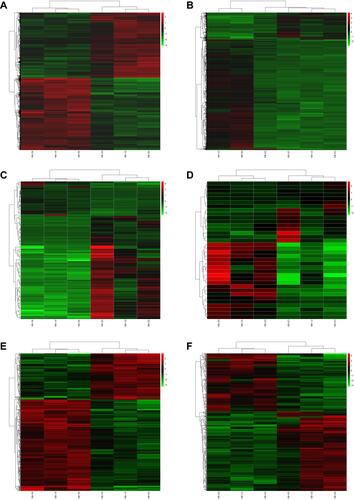
Figure 2 Continue.
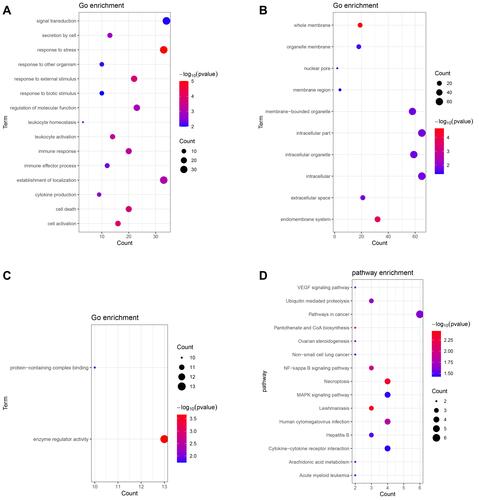
Figure 2 Significantly enriched GO terms and KEGG pathways of up-regulated (A–D) and down-regulated (E–H) shared DEmRNAs in AMI and MF after AMI. (A and E) BP, biological process; (B and F) CC, cellular component; (C and G) MF, molecular function; (D and H) KEGG pathways. The x-axis shows counts of DEmRNAs enriched in GO terms or KEGG pathways and the y-axis shows GO terms or KEGG pathways. The color scale represented -lg p-value.
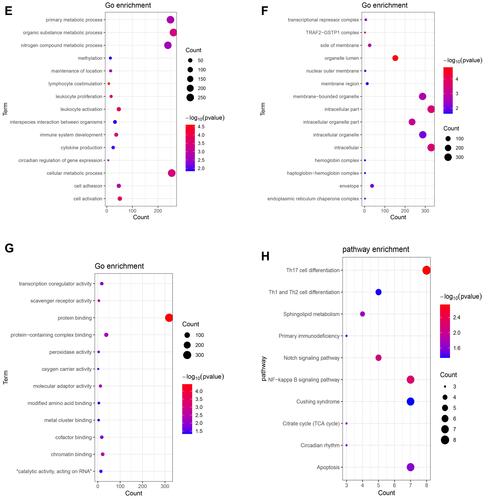
Table 2 Top 10 Up- and Down-Regulated DEmiRNAs
Table 3 Top 10 Up- and Down-Regulated DElncRNAs
Figure 3 CeRNA (DElncRNA-DEmiRNA-DEmRNA) regulatory network. The inverted triangles, rectangles and ellipses indicate DElncRNAs, DEmiRNAs and DEmRNAs, respectively. Red and green color represents up-regulation and down-regulation, respectively.
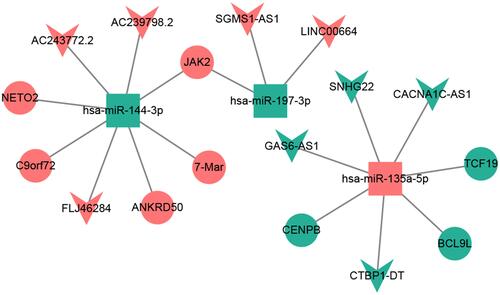
Figure 4 The qRT-PCR results of the DEmRNAs, DEmiRNAs and DElncRNAs in AMI (A) and MF after AMI (B). The x-axis represents the DEmRNAs/DEmiRNAs/DElncRNAs and the y-axis represents log2 (fold change). *Indicates p < 0.05, **Indicates that p < 0.01.
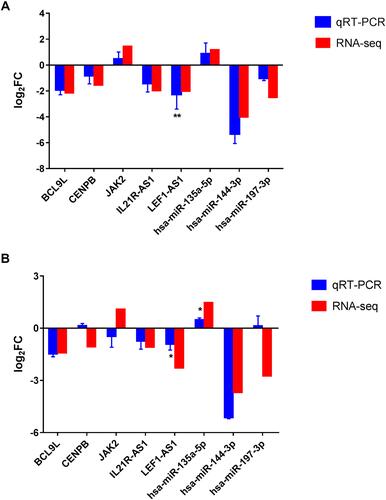
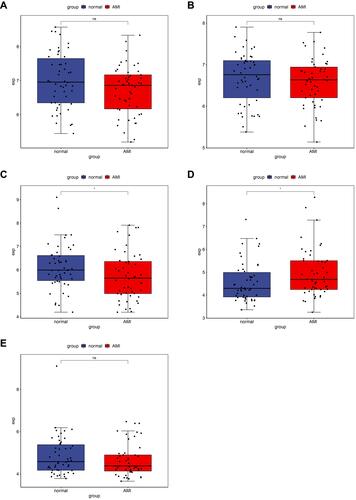
Figure 5 Validation of mRNAs and lncRNAs in GEO. The x-axes represent normal control and AMI groups. The y-axes represent gene expression levels. (A) BCL9L, (B) CENPB, (C) LEF1-AS1, (D) LINC00664, (E) SNHG22.