Figures & data
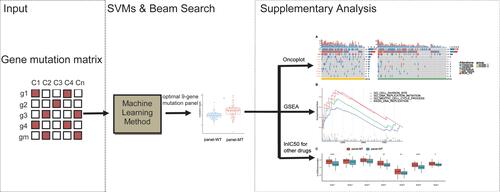
Table 1 The Pseudocode of Identification of Cisplatin-Sensitive and Cisplatin-Resistant Cell Lines
Figure 1 Flowcharts of the selection of the mutated resistance-related gene panel in this study. (A) Work flow of this paper. SVMs, support vector machines; WES, whole-exome sequencing. (B) Flowchart of the selection of the mutated resistance-related gene panel. N indicates the sample size.
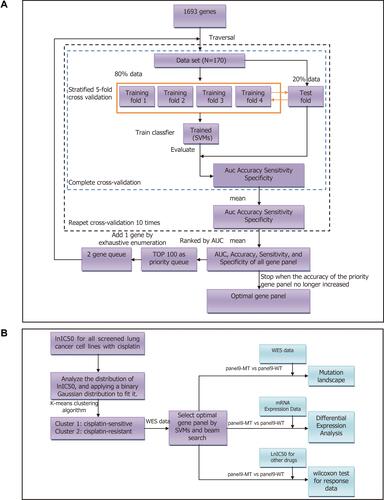
Figure 2 IC50 distribution of cisplatin in lung cancer cells. (A) Fit curve displaying the distribution of lnIC50 values in 170 lung cancer cell lines. (B) Scatter plot of the IC50 distribution of cisplatin in 170 lung cancer cells. The first red dotted line shows the maximum screening concentration of 10.0 µM, and the second red dotted line at the bottom shows the minimum screening concentration of 0.0391 µM. The red dots correspond to the predicted cisplatin-resistant cell lines by the k-means method, and the blue dots correspond to the predicted cisplatin-sensitive cell lines.
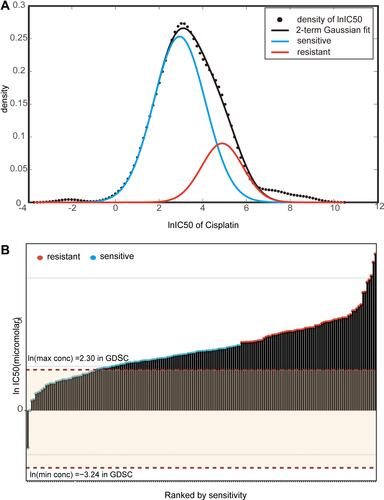
Table 2 A Summary of Priority Gene Panels (Means and Deviations)
Figure 3 The identified features can distinguish sensitive cell lines from drug-resistant cell lines. (A) Comparison of SVM algorithms containing 1–9 characteristic genes. When more gene features are included, the accuracy and sensitivity of the SVM algorithm can be substituted, as with AUC. (B) Regardless of the subtype of lung cancer, the lnIC50 values of cell lines containing any mutations in the 9 genes were significantly higher, and these cell lines were resistant to cisplatin. (C) Considering the subtypes of lung cancer, with the exception of EMSO, cell lines containing mutations in the 9 genes had significantly higher lnIC50 values and were resistant to cisplatin. (D) Correlation analysis of cluster labels between SVMs and the k-means method. Cluster 0 by k-means was significantly enriched in more panel-WT cell lines. *, **, ***, ****, P<0.05, P<0.01, P<0.001, P<0.0001.
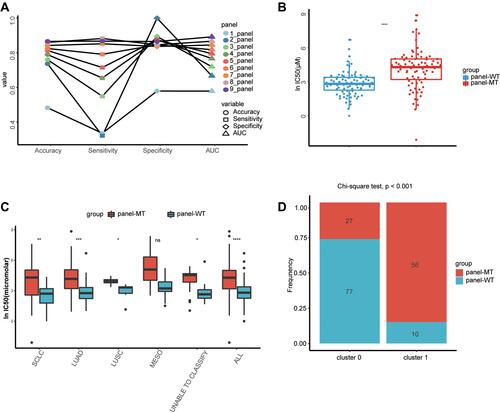
Figure 4 The identified features can be extended to other chemotherapy drugs in the GDSC database. (A) With regard to chemotherapeutic agents recommended by the latest NCCN guidelines of SCLC and NSCLC, the lnIC50 of the drugs were significantly different between the groups, except for gemcitabine and paclitaxel. (B) Among the recommended targeted drugs, none had significant differences in lnIC50 between the panel-MT and panel-WT groups. *, **, ****, P<0.05, P<0.01, P<0.0001.
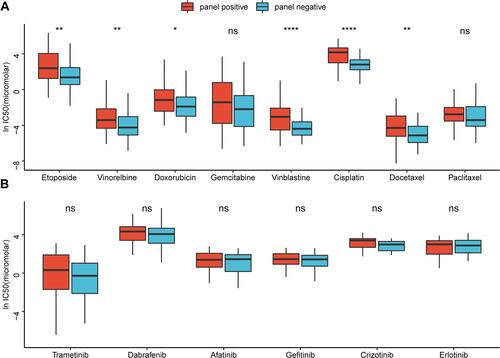
Figure 5 Differences in gene mutations between the panel-MT and panel-WT groups. (A) The TMB in the panel-MT group was significantly higher (p <0.001). (B) The number of mutations of the overall DDR and HR pathways in the panel-MT group was significantly higher than that in the panel-WT group (p <0.05). (C) The top 20 mutant genes and genes in the panel are grouped by the results of k-means clustering. Fisher’s exact test was used to test the associations between the panel status and the mutated genes. *, **, ****, P<0.05, P<0.01, P<0.0001.
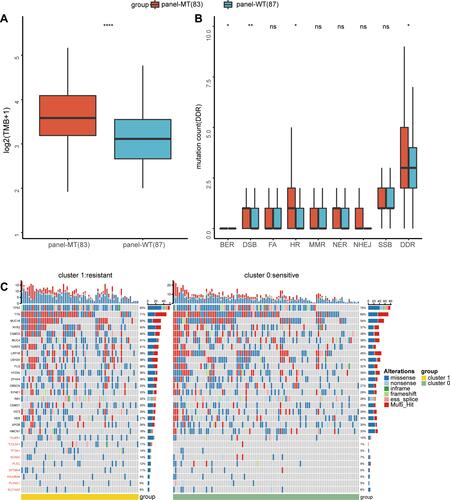
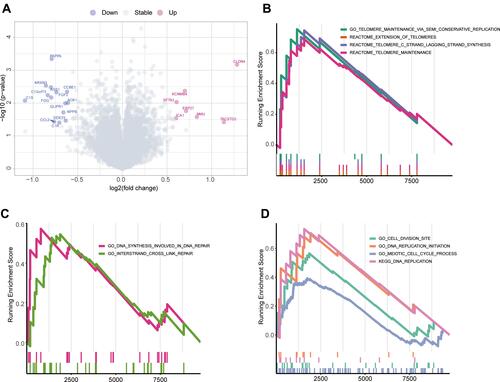
Figure 6 Differences in molecular and pathway expression between the panel-MT and panel-WT groups. (A) Differentially expressed genes between the panel-MT and panel-WT groups. A total of 14 genes were upregulated in the panel-WT group when the p value <0.05 and FC > 3/2 or FC < 2/3. FC, fold change. (B–D) The GSEA results show the significantly enriched pathways in the panel-MT group. Pathways related to telomerase maintenance (B) and the cell cycle (D) were enriched in the panel-MT group. DNA synthesis involved in DNA repair and interstrand crosslink repair pathways were significantly enriched in the panel-MT group (C).