
Figures & data
Figure 1 Flow chart of study population and groups.
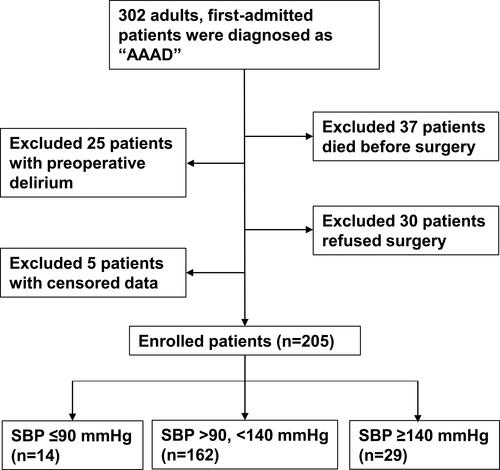
Table 1 Baseline Characteristics According to Admission Systolic Blood Pressure
Table 2 Treatments Between SBP Groups
Table 3 Outcomes Difference Between SBP Groups
Table 4 Predictors of POD on Univariate Logistic Regression and Cox Proportional Hazards Analysis
Table 5 ORs (95% CIs) for Delirium Across Groups of Admission Systolic Blood Pressure
Table 6 Subgroup Analysis of the Association Between Systolic Blood Pressure and Delirium