Figures & data
Figure 1 Relationship between STC1 expression and clinical characteristics in TCGA and GEO databases. STC1 expression according to different stages (A), pathologic T stages (B) and grades (C) of BLCA in TCGA database. (D) Kaplan–Meier analysis of overall survival in TCGA database. (E) Different STC1 expression between NMIBC and MIBC in GSE13507. (F) STC1 expression according to different T stages of BLCA in GSE128959. **P value < 0.01, ***P value < 0.001, ns means no significant difference.
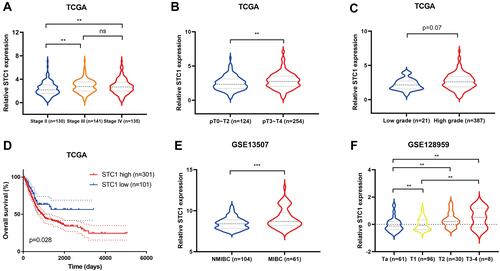
Figure 2 Relationship between STC1 expression and clinical characteristics in clinical specimens. (A) Representative IHC images showing BLCA samples with different stages immunostained for STC1. (B) Different IRS of STC1 between NMIBC and MIBC. (C) IRS of STC1 according to different T stages of BLCA. **P value < 0.01.
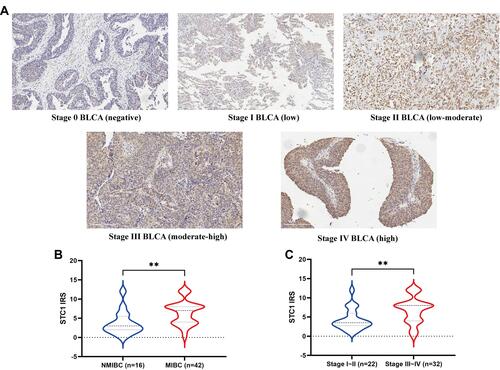
Figure 3 Association between STC1 expression and survival in clinical specimens. (A) Higher IRS of STC1 is associated with worse overall survival. (B) Correlation between IRS of STC1 and overall survival time. (C) Different STC1 expression in dead and alive BLCA patients. **P value < 0.01.
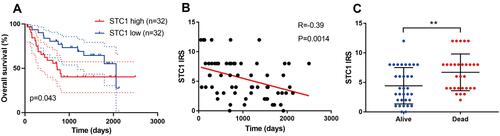
Figure 4 Association between STC1 and common immune checkpoints expressions in TCGA database.
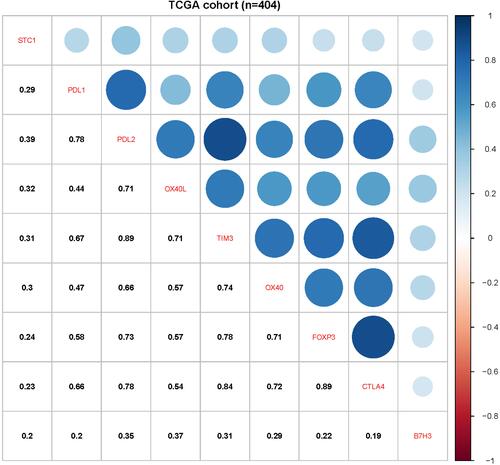
Figure 5 Association between STC1 and PDL1 expression. (A) Representative IHC images showing BLCA samples immunostained for STC1 and PDL1. (B) Different PDL1 expression according to STC1 levels.
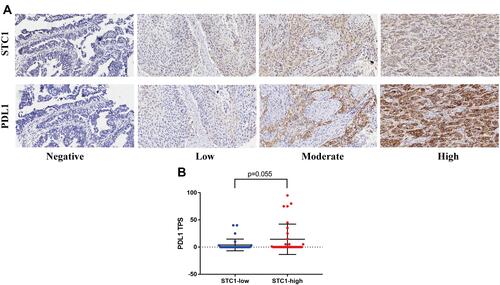
Figure 6 Association between STC1 and CD3+ T cells infiltration level. (A) Representative IHC images showing BLCA samples immunostained for STC1 and CD3. (B) Different density of CD3+ T cells infiltration according to STC1 levels. *P value < 0.05.
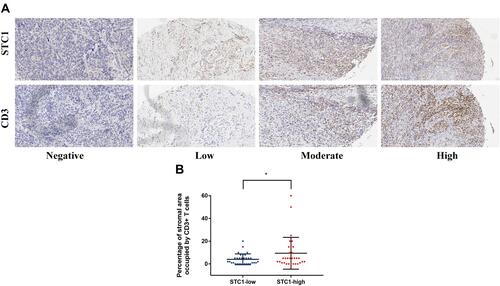
Figure 7 The heatmap of correlated immune genes that associated with STC1 in TCGA. 318 genes were positively correlated with STC1 expression while 59 genes were inversely correlated with STC1 expression.
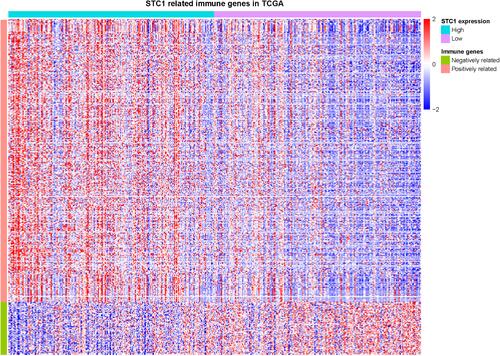
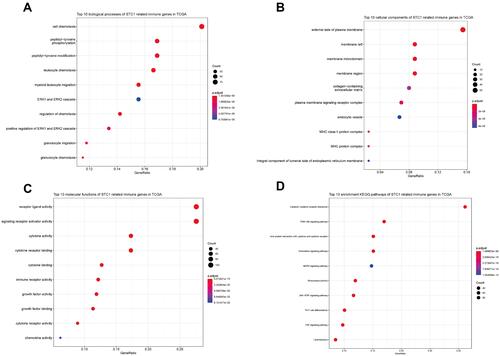
Figure 8 Functional enrichment analysis of STC1-related immune genes in TCGA. Top 10 enriched biological processes (A), cellular components (B), molecular functions (C) and KEGG pathways (D) terms were shown in this study.