Figures & data
Figure 1 The expression level of KDM5 subfamily (A–D) across different tumor types and normal tissues in TCGA database were detected by TIMER. The expression level of LUAD and LUSC was emphasized in rectangle, respectively. *p<0.05, **p<0.01, ***p<0.001. TPM, transcripts per million.
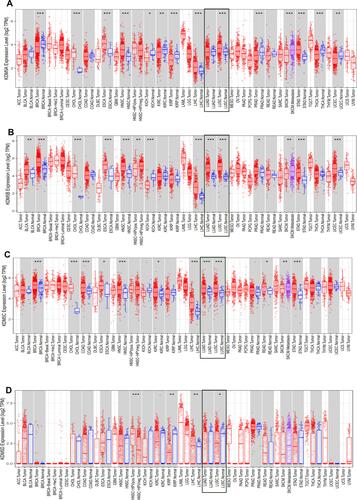
Figure 2 The mRNA expression of KDM5 subfamily members between 515 LUAD and 59 normal tissues (A), 503 LUSC and 52 normal tissues (B). ***p<0.001. The relative level of KDM5 subfamily in NSCLC (C).
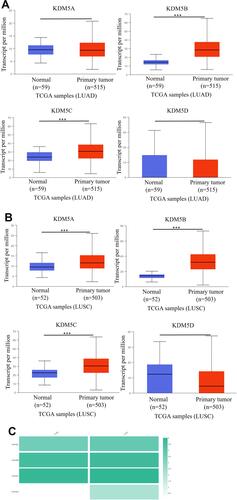
Figure 3 Genetic mutations in KDM5 subfamily members of LUAD (A) and LUSC (B) patients using cBioPortal. The association between prognostic features and the mRNA expression of distinct KDM5 subfamily in lung cancer patients using Kaplan–Meier plotter (C–F). The OS, FP, and PPS survival curves comparing patients with high (red) and low (black) expression at the threshold of p-value of<0.05.
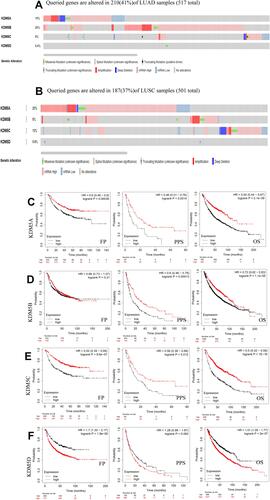
Figure 4 The correlation between each type of tumor-infiltrating immune cells (B cells, CD4+ T cells, CD8+ T cells, neutrophils, macrophages, and dendritic cells) and KDM5 subfamily in LUAD and LUSC (A–D).
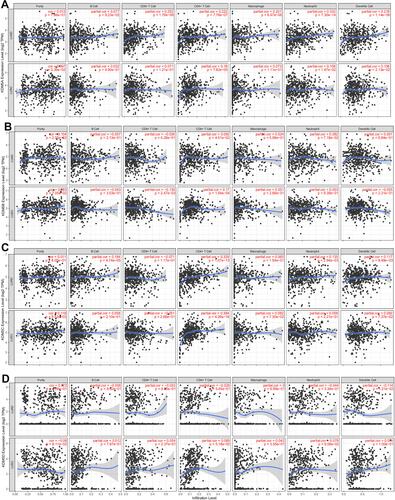
Table 1 Correlation Analysis Between KDM5A/B/C and Markers of Immune-Infiltrating Cells
Figure 5 Scatterplots of correlation analysis between KDM5A/B/C/D and immunological markers of Treg (STAT5B) (B) and Th17 (STAT3) (A) cells in LUAD and LUSC using TIMER.
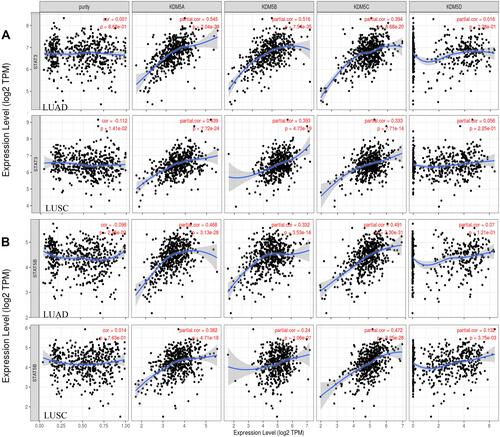
Figure 6 Associations between KDM5A/B/C/D expression and immune subtypes in LUAD (A) and LUSC (B). C1 (wound healing); C2 (IFN-γ dominant); C3 (inflammatory); C4 (lymphocyte depleted); C5 (immunologically quiet); C6 (TGF-β dominant).
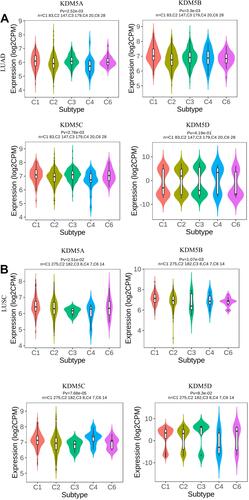
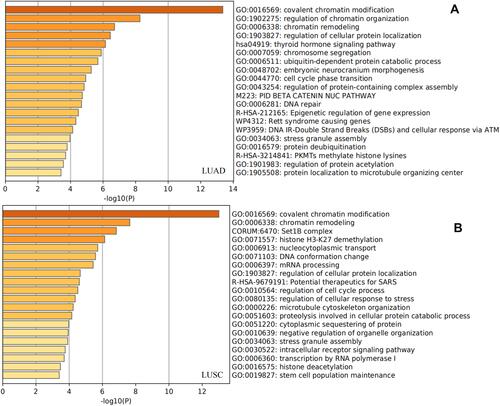
Figure 7 Gene enrichment analysis of KDM5A/B/C subfamily members and their 120 co-expression genes in LUAD (A) and LUSC (B) patients.