Figures & data
Table 1 Clinical Characteristics and Therapy Information in TCGA Cohort
Figure 1 The preliminary selection of candidate prognostic genes by Lasso methods. (A) Ten-time cross-validation for tuning parameter selection in the Lasso model. (B) Partial likelihood deviation map with Lasso approach. (C) Coeff-values of the preliminary selected 24 genes. (D) ROC curve for the preliminary selected 24 genes.
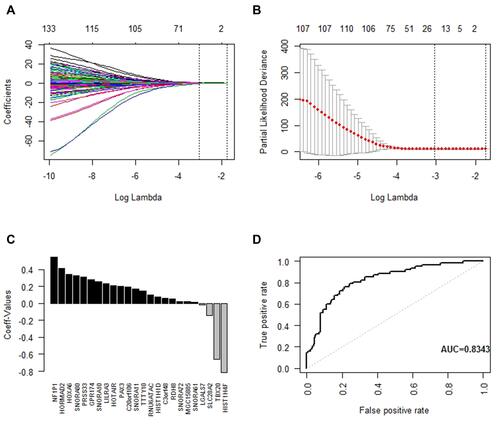
Figure 2 Kaplan–Meier curves of the five-gene signature for high- (n = 136) and low-risk (n = 136) patients with lower-grade gliomas in TCGA database.
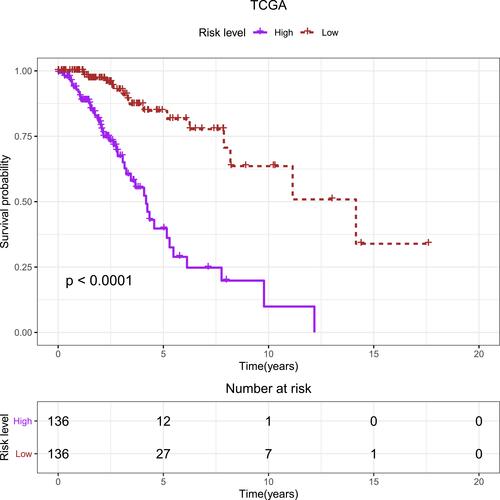
Figure 3 Kaplan–Meier curves of the five-gene signature for high- (n = 136) and low-risk (n = 136) patients with lower-grade gliomas stratified by age, gender, tumor grade, and seizures status in TCGA database.
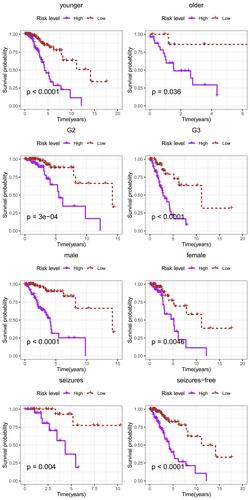
Figure 4 ROC of the five-gene signature for predicting the 1-, 3- and 5-year survival of 272 patients with lower-grade gliomas in TCGA database.
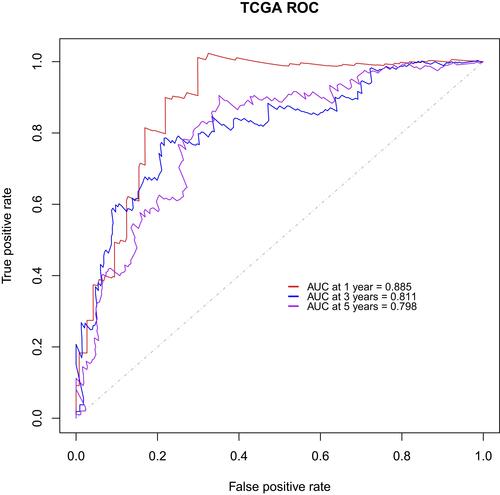
Figure 5 Kaplan–Meier curves of the five-gene signature for high- (n = 136) and low-risk (n = 136) patients with lower-grade gliomas stratified by age, gender, tumor grade, and seizures status in CGGA database.
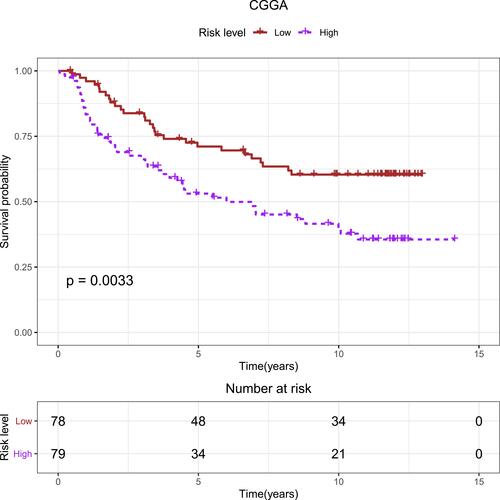
Figure 6 ROC of the five-gene signature for predicting the 1-, 3- and 5-year survival of 157 patients with lower-grade gliomas in CGGA database.
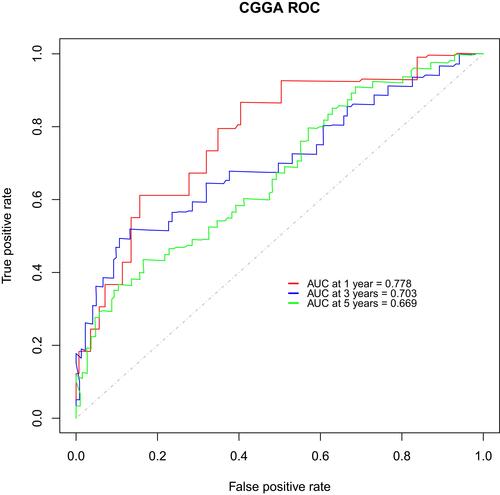
Table 2 Cox Regression Analysis of Clinical Pathologic Features for OS in TGGA Cohort
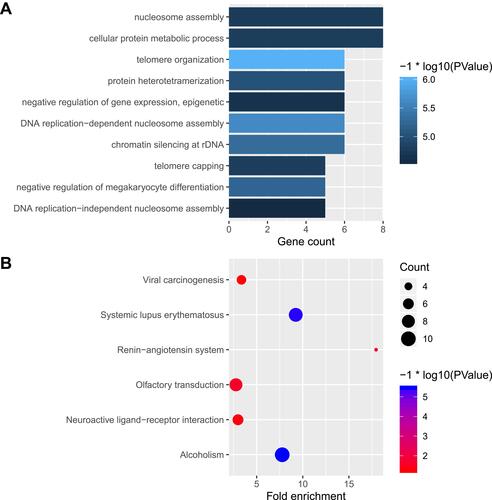
Figure 7 Functional enrichment analysis of DEGs between different seizures presentations in lower-grade gliomas. (A) GO enrichment analysis of DEGs between different seizures presentations in lower-grade gliomas. (B) KEGG pathways of DEGs between different seizures presentations in lower-grade gliomas.